Evaluation methodology of MSU Deinterlacer Benchmark
Dataset
Our dataset is constantly updated. Now we have 28 video sequences. Each sequence contains 60 frames. Resolution of all video sequences is 1920x1080. FPS varies from 24 to 60. TFF interlacing was used to get interlaced data from GT.
Click on this text to read how exactly our current dataset was composed.
Initially, we had about 10.000 videos, downloaded from Vimeo. These videos included sports, animation, panorama, news, landscapes, parts of movies, tv shows, ads, and many other types of content. We decided to restrict the size of the dataset by a maximum of 30 videos, each containing 60 frames. Our goal was to create the most diverse dataset, respecting given restrictions.
- The first goal was to cluster 10.000 videos. For this purpose, we mapped the videos into 2D space by calculating their Google Si/Ti, determined, for example, in this paper. For calculating Google Si/Ti we used FFmpeg x264 codec with options [-qp 28 -b_qfactor 1 -i_qfactor 1].
- Then, we performed a simple K-Means Clustering in this 2D space to divide the videos into 30 clusters.
- Then, we measured the distances between centers of clusters and all the videos from the cluster. We chose 30 videos, closest to the centers of 30 clusters. These 30 videos included some hard-cases for deinterlacers, such as running letters, scene changes, motion, etc.
- Another big part of dataset composing was to choose 60-frame cuts from these 30 big videos. To do that, we performed the same process, as in steps 1-3, but now the goal was to choose 30 cuts from about 15.000 cuts. Again, we calculated Google Si/Ti for each 60-frames cut and clustered them into 30 clusters. 2 clusters contained only black and only white cuts respectfully, so we marked them as "trash" clusters.
- Then, we selected top-5 cuts, closest to the center of each non-"trash" cluster.
- The final step was to manually choose the best from top-5 cuts for each non-"trash" cluster.
- We don't count PSNR on black frames. They were made for deinterlacers that use motion estimation (ME). Because of the black frames, ME-deinterlacer detects zero motion between two sequences and, therefore, doesn't consider motion from the previous sequence while processing the current one.
Metrics
We compare RGB frames via 3 metrics - PSNR, SSIM, and VMAF. PSNR, SSIM, and VMAF are measured over the Y-component.
For each video sequence, we take the average PSNR, SSIM, and VMAF over all frames. We decided to choose these metrics because they proved themselves to be among the best metrics to show a quality loss.
We decided to measure these metrics over the Y component because YUV is the most popular type of colorspace nowadays, but there are still a lot of versions of YUV (e.g. yuv444p, yuv420p, yuv420p12le). In these versions U and V components are different, that's why we measure only the Y component. Also, there are a lot of other color spaces, which use the Y component (e.g. YCbCr, YPbPr, UYVY, ...). Finally, we can easily compute the Y component from other color spaces, such as RGB or gray.
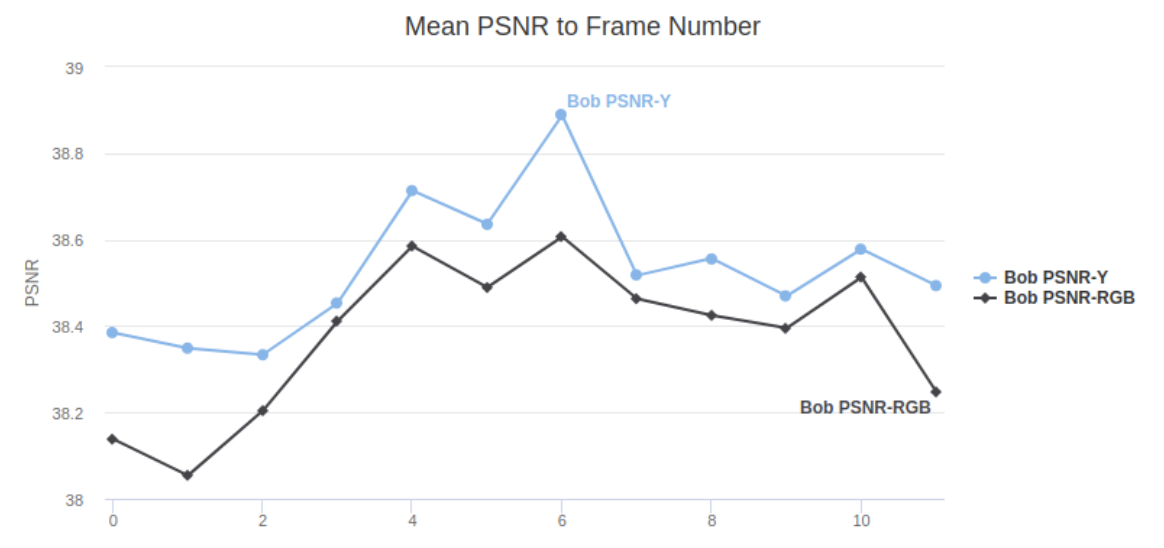
Here is the plot of the PSNR difference between PSNR-Y and PSNR-RGB. As we can see here, the difference is rather negligible.
Subjective comparison
Also, we provide MOS (Mean Opinion Score) for the best 16 deinterlacers (excluding different versions of the same deinterlacer).
To get MOS, we host a subjective comparison using www.subjectify.us. We get the same crops (of areas with the worst PSNR) from each test video, and then assessors compare output of each deinterlacer against all others. We get 10 comparison results for each crop-crop pair, and then we use Bradley-Terry model to get MOS scores
Validation of deinterlacers' outputs
Another important direction of our work is to control the outputs of deinterlacers. Sometimes, it can convert colorspace, work in BFF mode instead of TFF, or maybe have bugs.
Click on this text to read how exactly we validate deinterlacers' outputs.
The main criteria are that the PSNR between GT fields and the same fields in the deinterlaced video must be equal to infinity. To control this, we make Top-Fields and Bottom-Fields plot on every second frame of GT video and deinterlaced video.
Here is the sample plot for Bob-Weave Deinterlacer. This deinterlacer passed the validation.
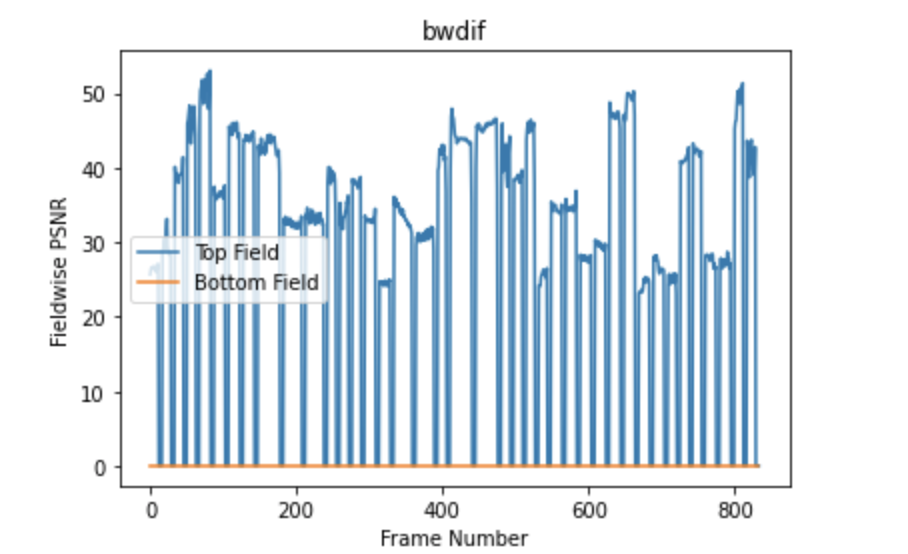
PSNR between Bottom-Fields of every deinterlaced frame and GT frame is equal to infinity, so we substitute infinity by zero. This means, that the bottom field exactly matches the corresponding field in the GT sequence.
Another sample plot, for MSU Deinterlacer, which had problems with colorspace.

As we can see here, Bottom-Field PSNR is about 100, but not infinity. In such cases, we make the following steps:
- Convert GT data to the colorspace of the deinterlacer.
- If we don't know (can't guess) which colorspace the deinterlacer uses, we form the LookUp-Table from the fields of the deinterlacer output and GT data, which must be equal to each. Then, we use this LookUp-Table to map GT to the colorspace of the deinterlacer.
- In some cases, it is impossible to precisely determine LookUp-Table because the mapping is neither injective nor surjective. In such hard cases, we just choose a GT sample with the highest PSNR from the previous 2 steps.
Also, we provide MSU Video Quality Measurement Tool (VQMT) PSNR visualization of the deinterlacer output. As the last step of the validation process, we check, that the VQMT PSNR visualization is striped. It should be so because even/odds rows must exactly match the corresponding GT rows.
Here is the example of correct VQMT PSNR visualization output:

And, finally, let us take a closer look at it:
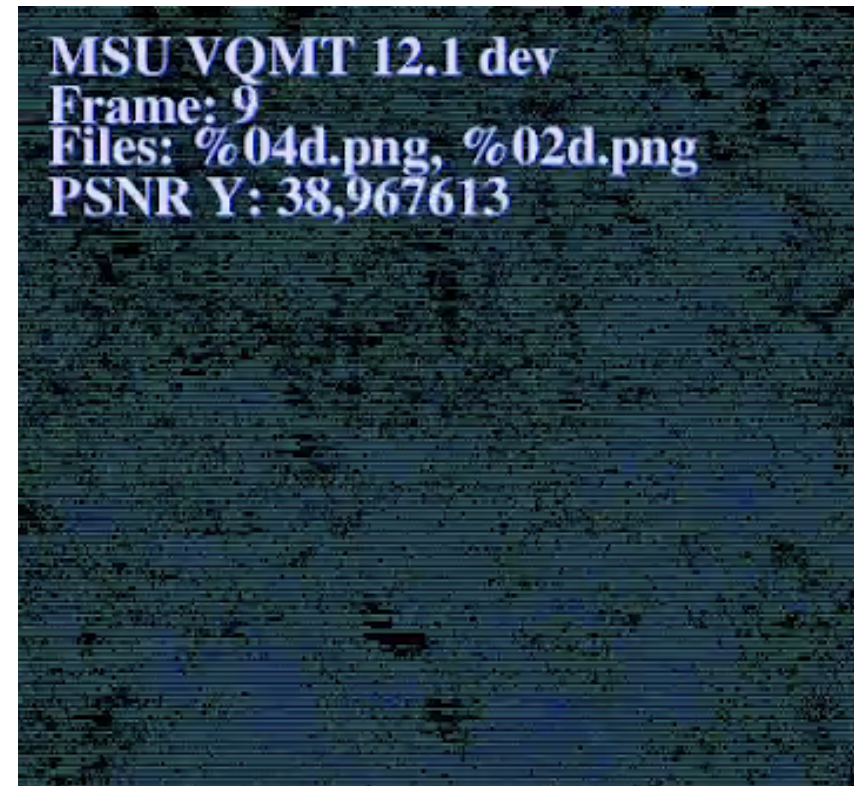
As we can see, the output is stripped, so this means that the deinterlacer passed the last validation step.
-
MSU Benchmark Collection
- Super-Resolution Quality Metrics Benchmark
- Video Colorization Benchmark
- Video Saliency Prediction Benchmark
- LEHA-CVQAD Video Quality Metrics Benchmark
- Learning-Based Image Compression Benchmark
- Super-Resolution for Video Compression Benchmark
- Defenses for Image Quality Metrics Benchmark
- Deinterlacer Benchmark
- Metrics Robustness Benchmark
- Video Upscalers Benchmark
- Video Deblurring Benchmark
- Video Frame Interpolation Benchmark
- HDR Video Reconstruction Benchmark
- No-Reference Video Quality Metrics Benchmark
- Full-Reference Video Quality Metrics Benchmark
- Video Alignment and Retrieval Benchmark
- Mobile Video Codecs Benchmark
- Video Super-Resolution Benchmark
- Shot Boundary Detection Benchmark
- The VideoMatting Project
- Video Completion
- Codecs Comparisons & Optimization
- VQMT
- MSU Datasets Collection
- Metrics Research
- Video Quality Measurement Tool 3D
- Video Filters
- Other Projects