Ways of cheating on popular objective metrics: blurring, noise, super-resolution and others
Introduction
Recently, the Graphics & Media Lab Video Group organized several Super-Resolution (SR) benchmarks and it was necessary to select suitable quality metrics. Subjective comparison showed that the most popular video quality metrics — PSNR and SSIM — are not applicable to this task.
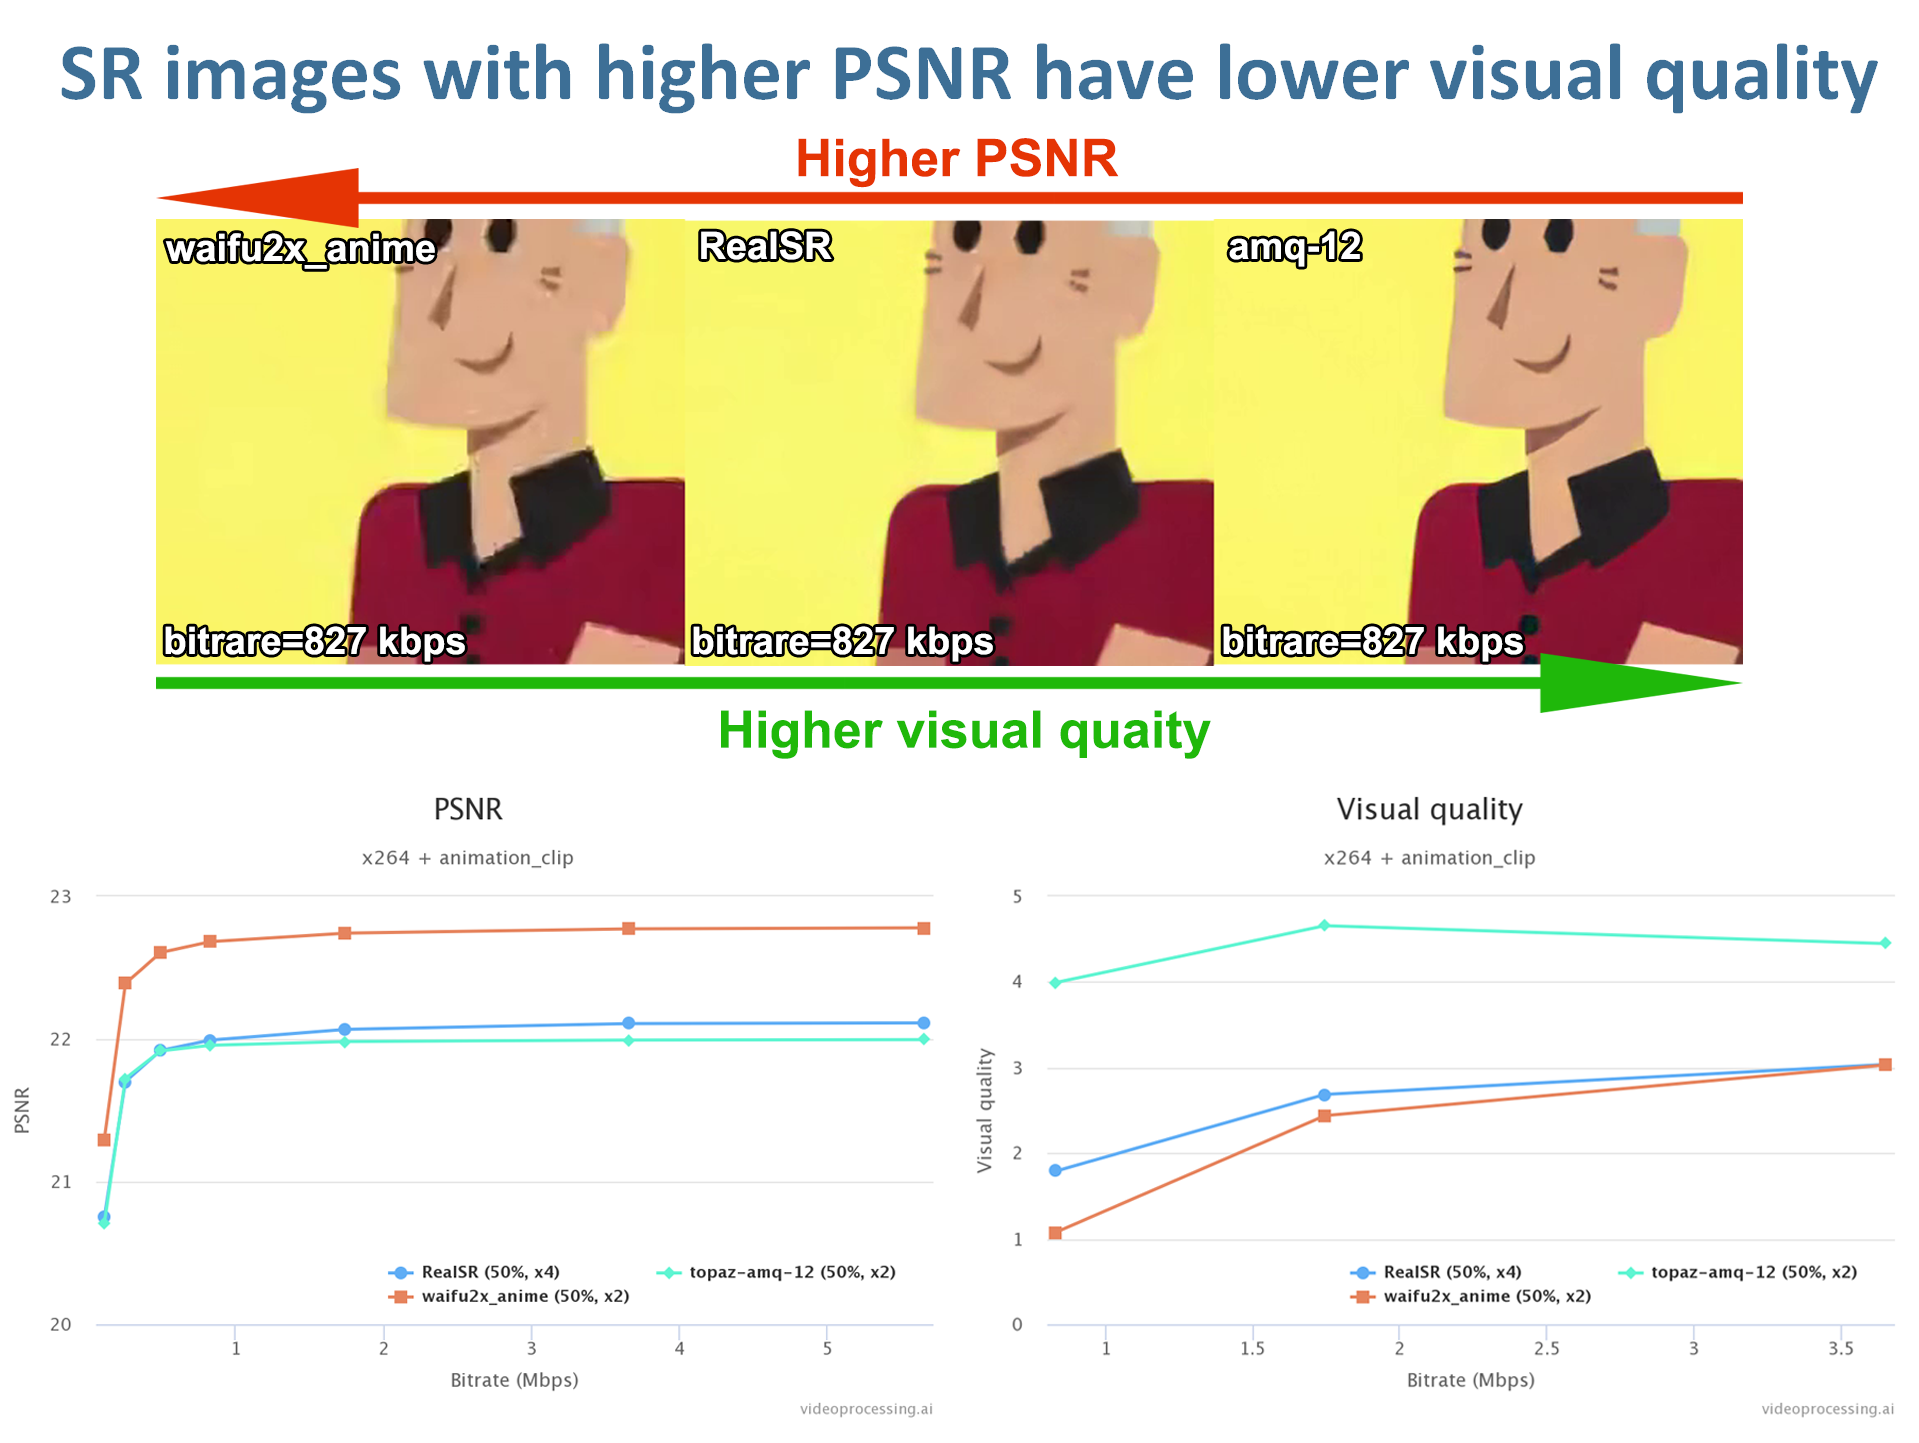
Fig. 1. Our examples of PSNR negative correlation with visual quality for Super-Resolution task
We collected some evidence for PSNR and SSIM inapplicability for SR, they are presented in this article below (section super-resolution).
Despite the drawbacks, PSNR still remains the most popular metric for estimating quality of SR. We analyzed 378 SR papers and it turned out that PSNR dominates at all times.
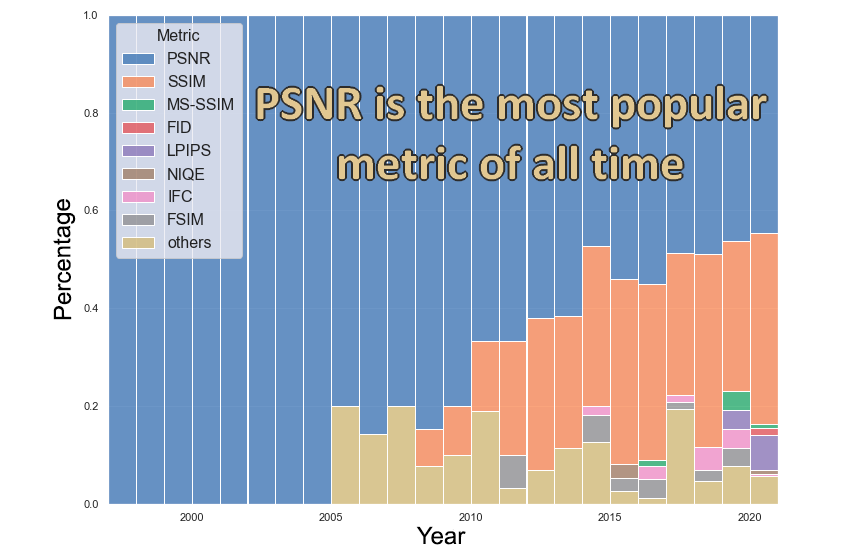
Fig. 2. The result of analysis of 378 SR articles
Popularity of PSNR, in our opinion, is caused by a number of attractive features:
• simple to compute (the running time of the metrics is a critical factor for many real applications)
• long history of usage (it's easy to compare performance of new algorithms to elder ones, which were evaluated using only PSNR)
• has clear physical meaning
• mathematically convenient in the context of optimization
Furthermore, there are other applications besides SR in which PSNR and SSIM exhibit weak performance, but are still commonly used. One of the main aims of this article is to summarize the criticisms of PSNR and SSIM. We are also going to cover topics like why so many people use PSNR and SSIM and where the limits of applicability of these metrics are.
Well-known examples of criticism
An illustrative example of shortcomings of the MSE (hence of the PSNR) is shown in the paper [1], where an original image is altered by different types of distortion and the distorted images have obviously different visual quality. However, MSE scores of the distorted images are identical.
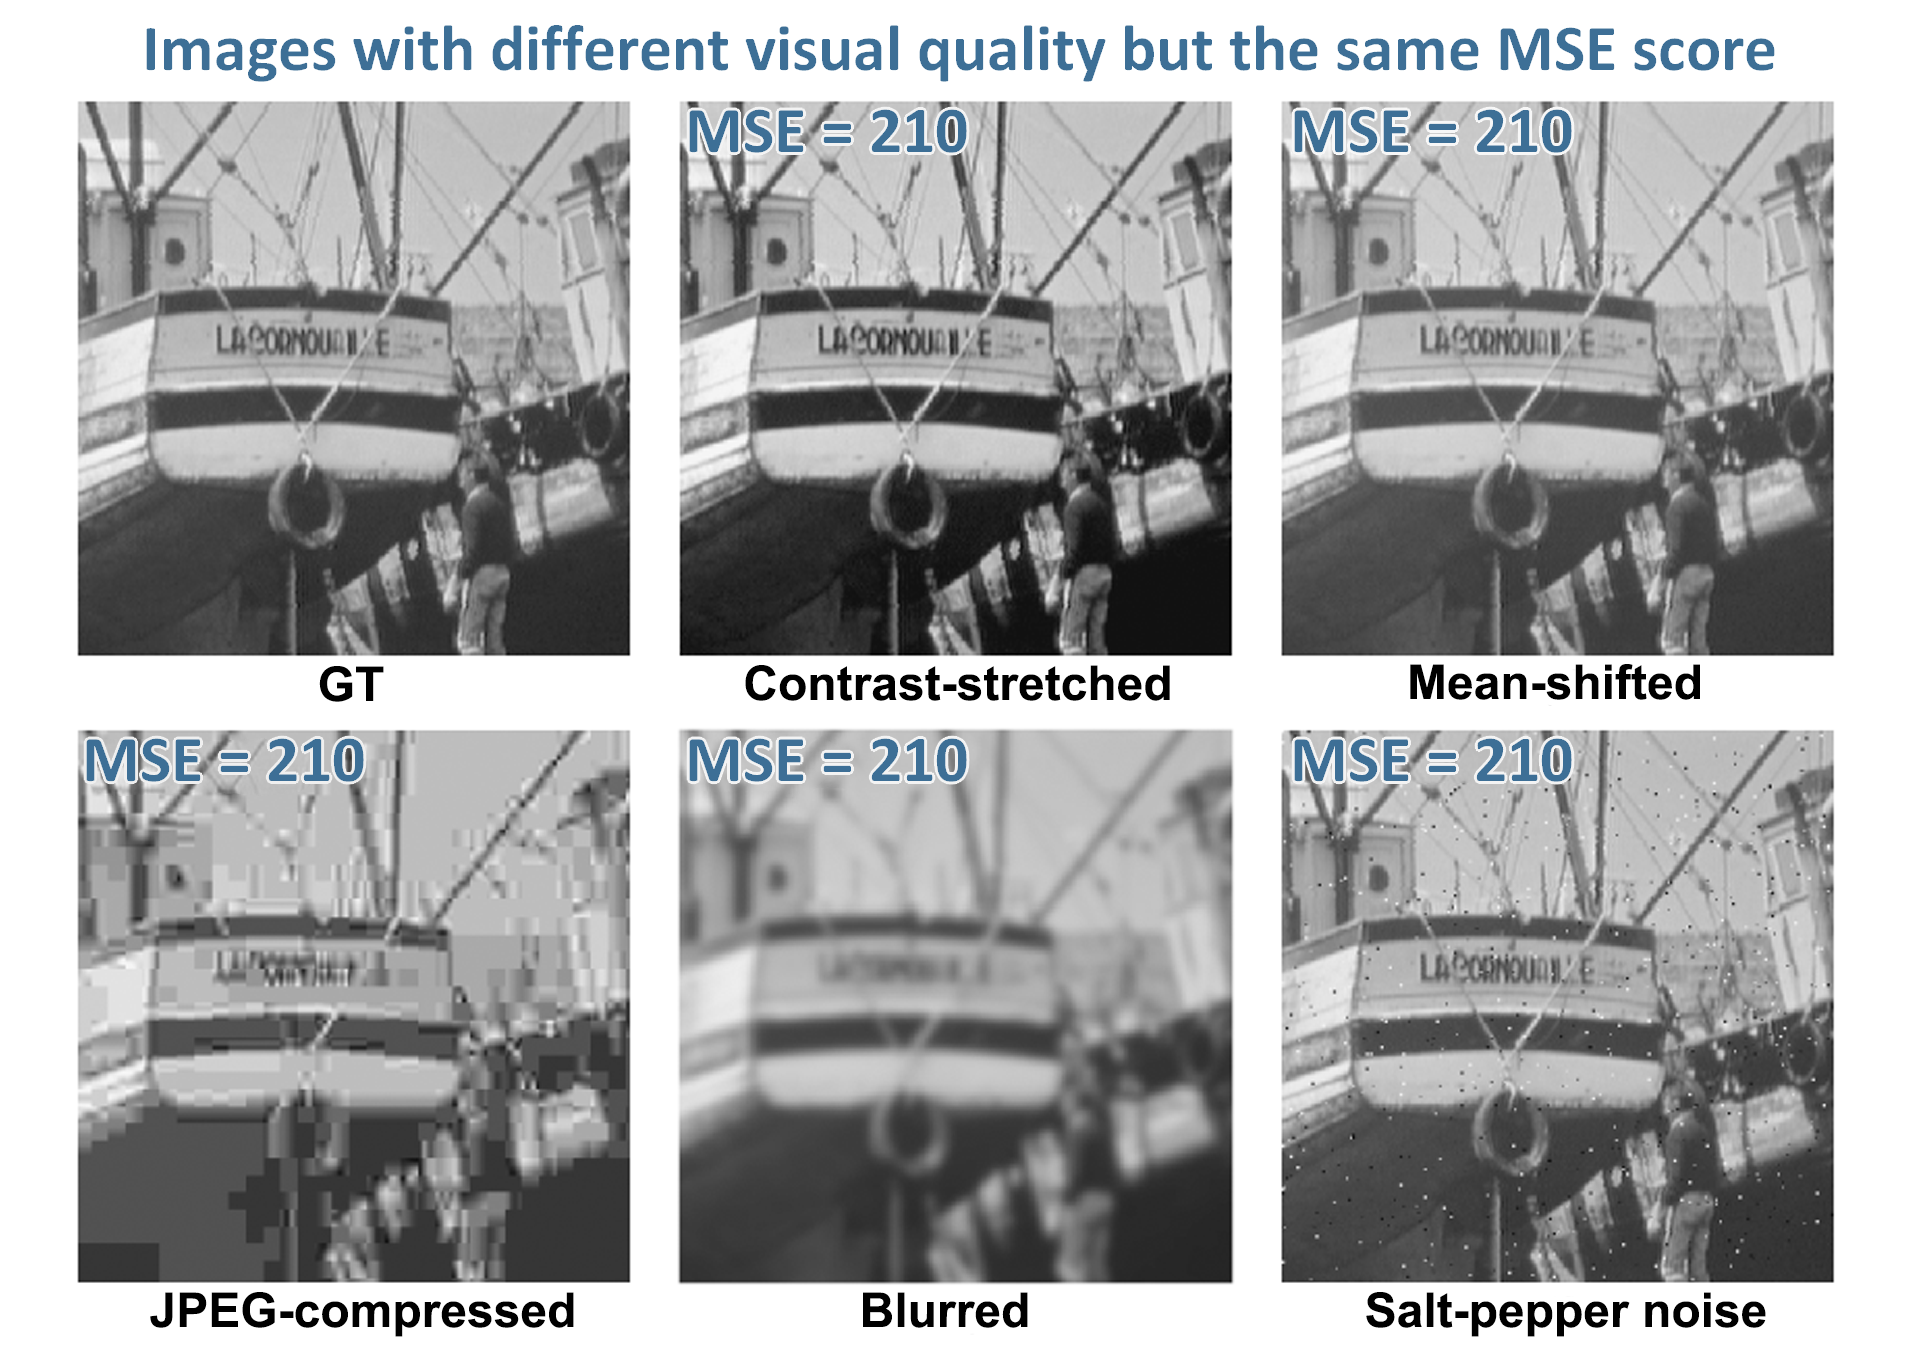
Fig. 3. Comparison of "Boat" images with different types of distortions, all with MSE = 210
Another example is found in the paper [2]: MSE scores are almost the same, but the visual quality of the right image is much worse. However SSIM handles this more faithfully.
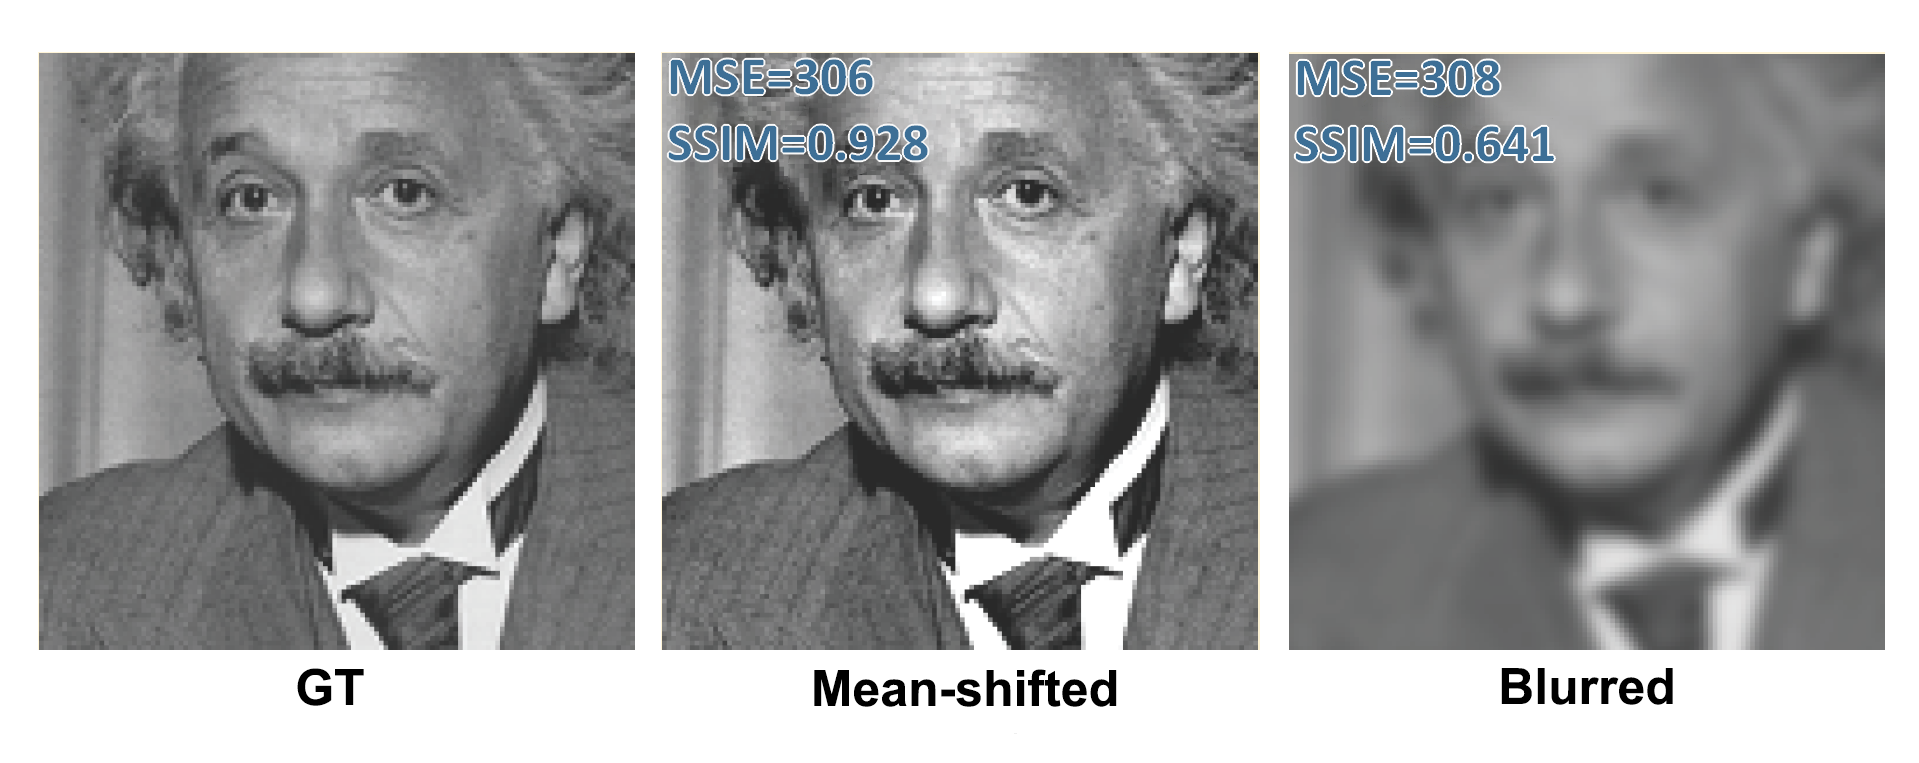
Fig. 4. Comparison of "Einstein" images with different types of distortions and almost the same MSE
According to the authors, it happens because SSIM seeks to measure structural distortion, while MSE does not. And it is what truly sets SSIM apart from PSNR. The human visual system is highly sensitive to structural distortions and easily compensates for nonstructural distortions.
However SSIM suffers from the same problem as PSNR. A similar example when SSIM scores are almost the same, but the visual quality differs a lot, can be found in the article [3].
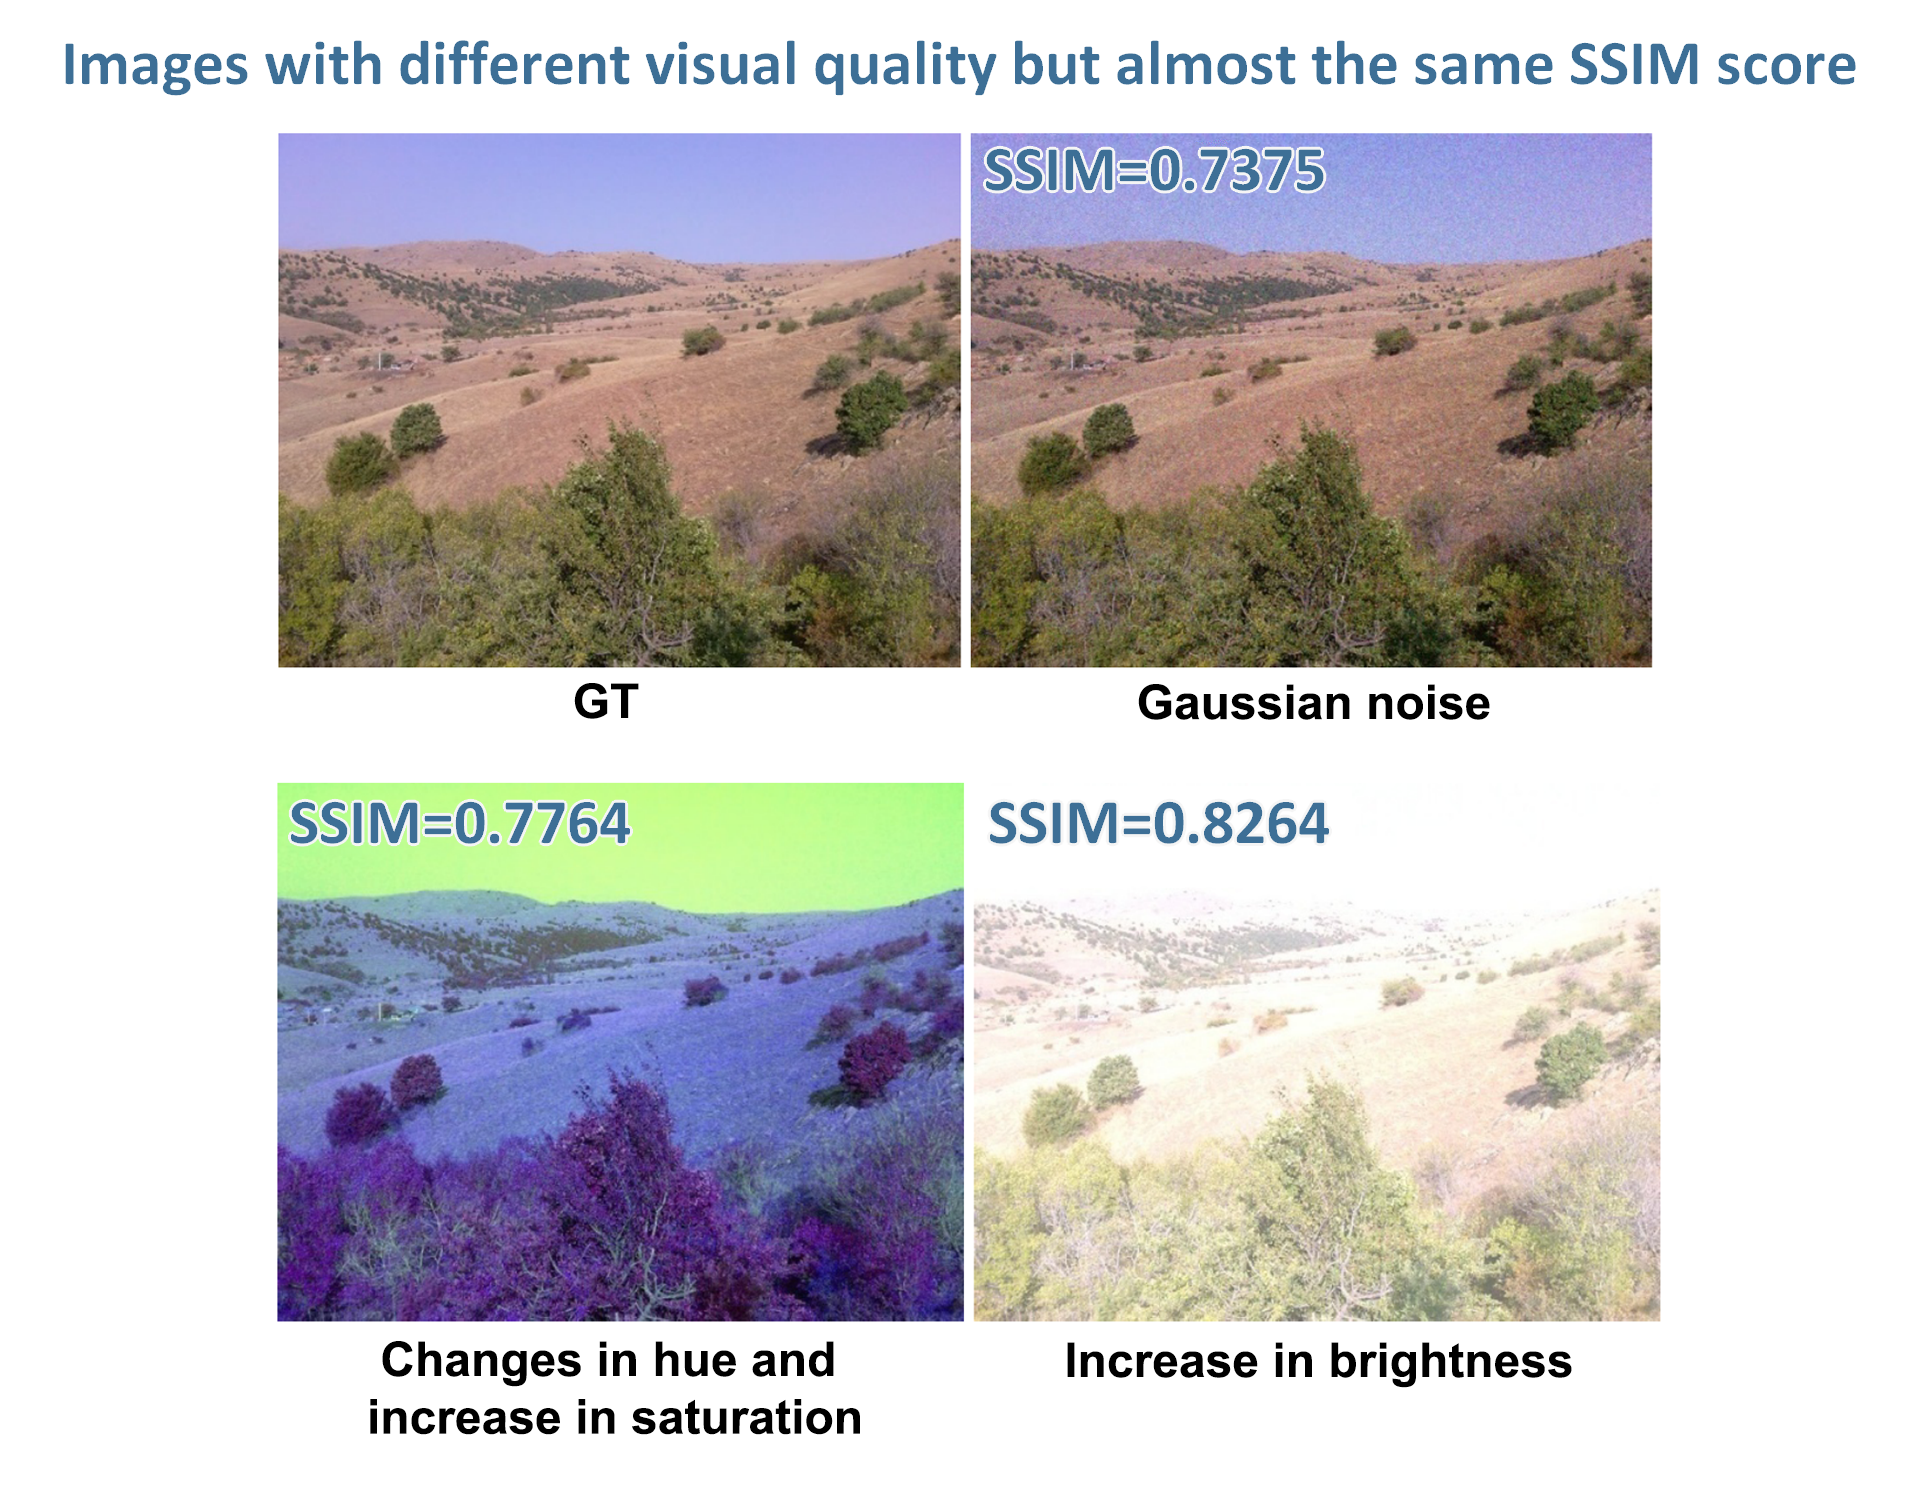
Fig. 5. Comparison of "The hills" images with different types of distortions and almost the same SSIM
Another funny example of unpredictable SSIM behavior can be found in [4].
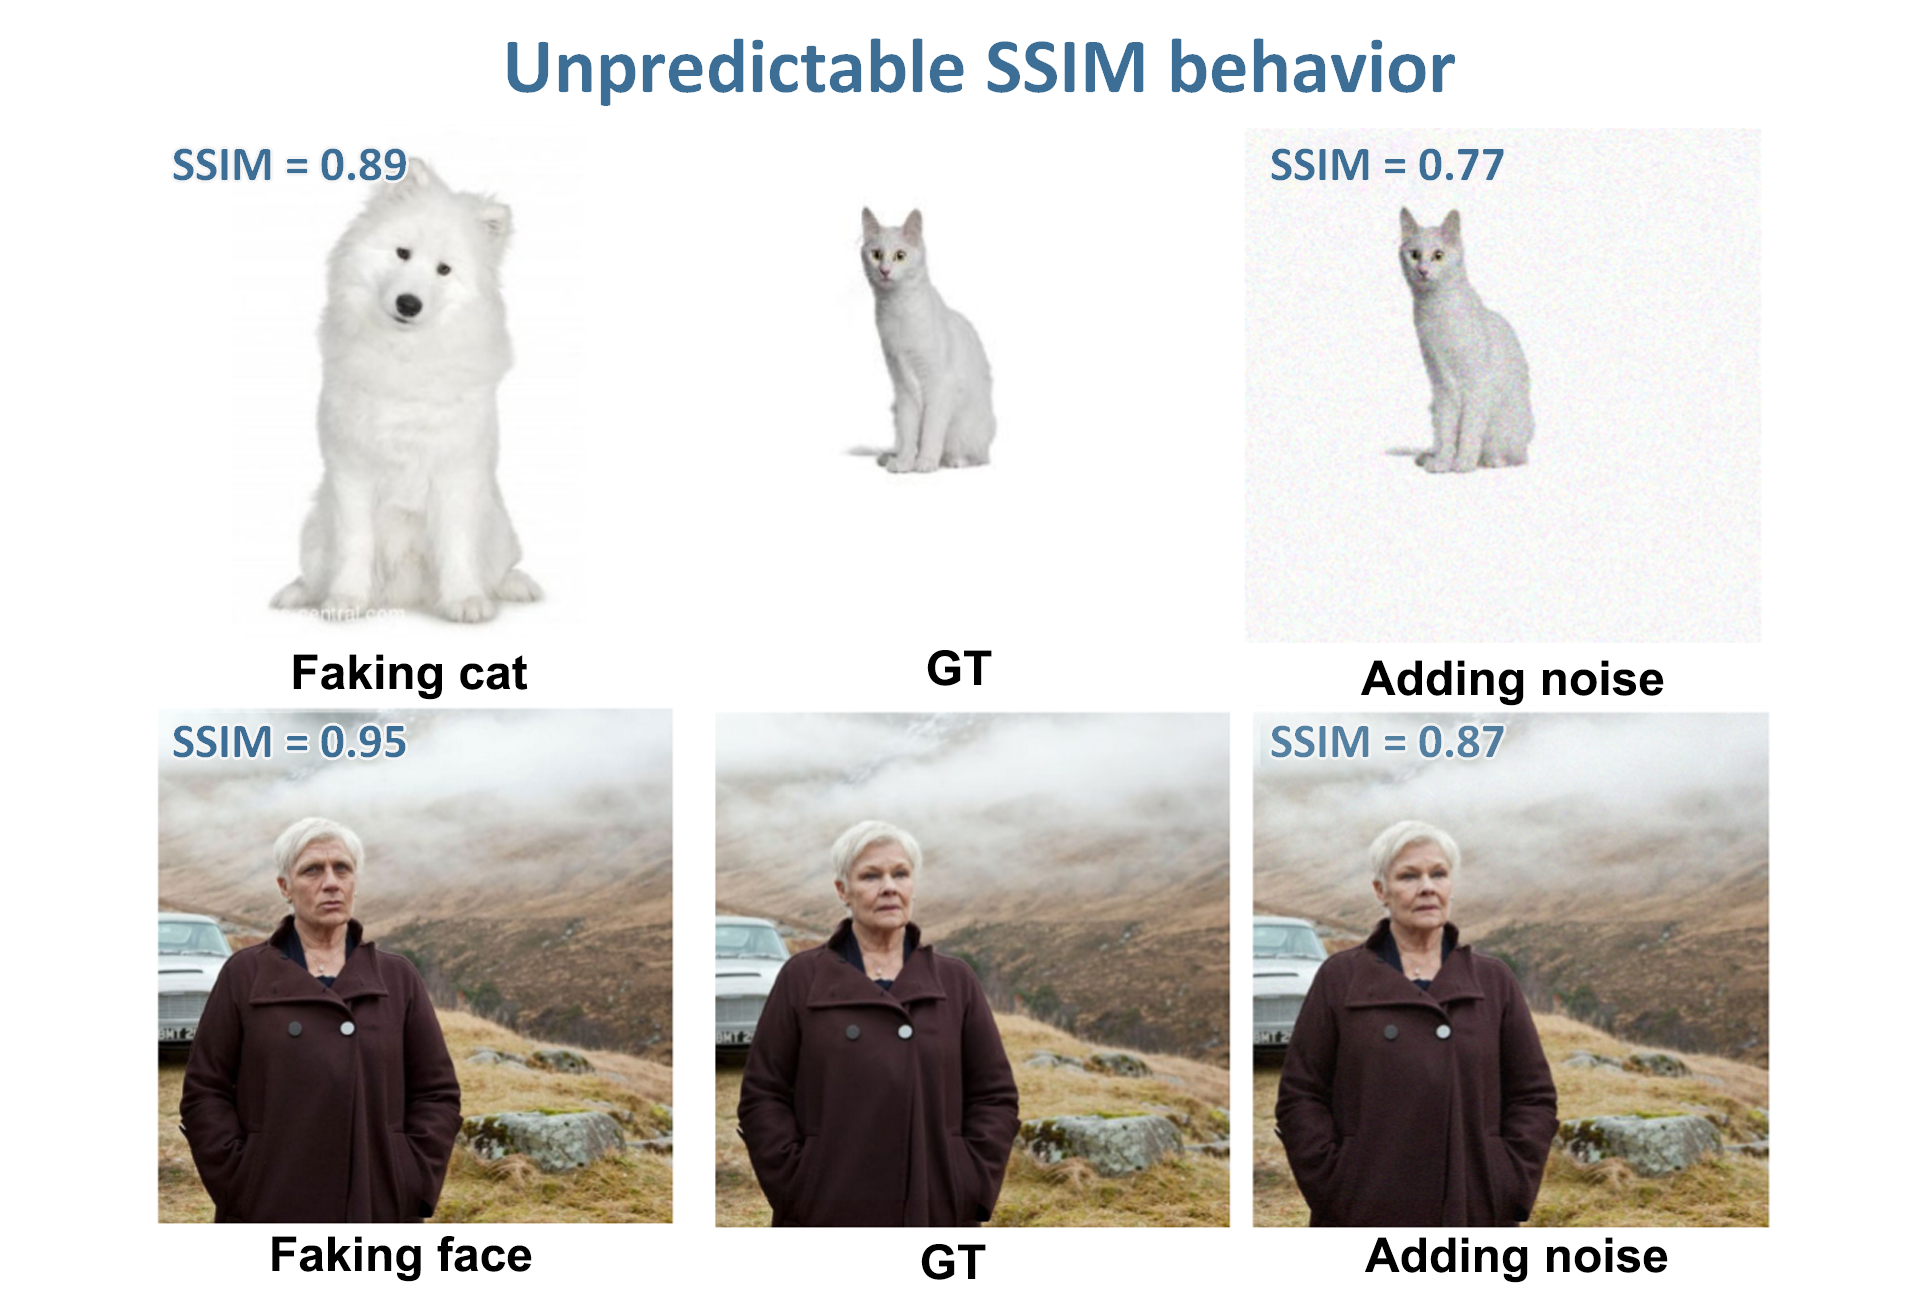
Fig. 6. Comparison of images with different types of distortions and their SSIM scores
Let's go through all the major types of distortions one at a time and detect advantages and drawbacks of PSNR and SSIM.
Blurring
As often happens, structural changes such as blurring can occur. But it has been demonstrated in [5] that MSE-based metrics may not be able to capture this reality.
When the algorithm causes blurring of images, SSIM reflects this fact more accurately, while MSE remains the same throughout the experiments. For this reason, it may be more appropriate to use the SSIM as a metric for any cases where blur may occur.
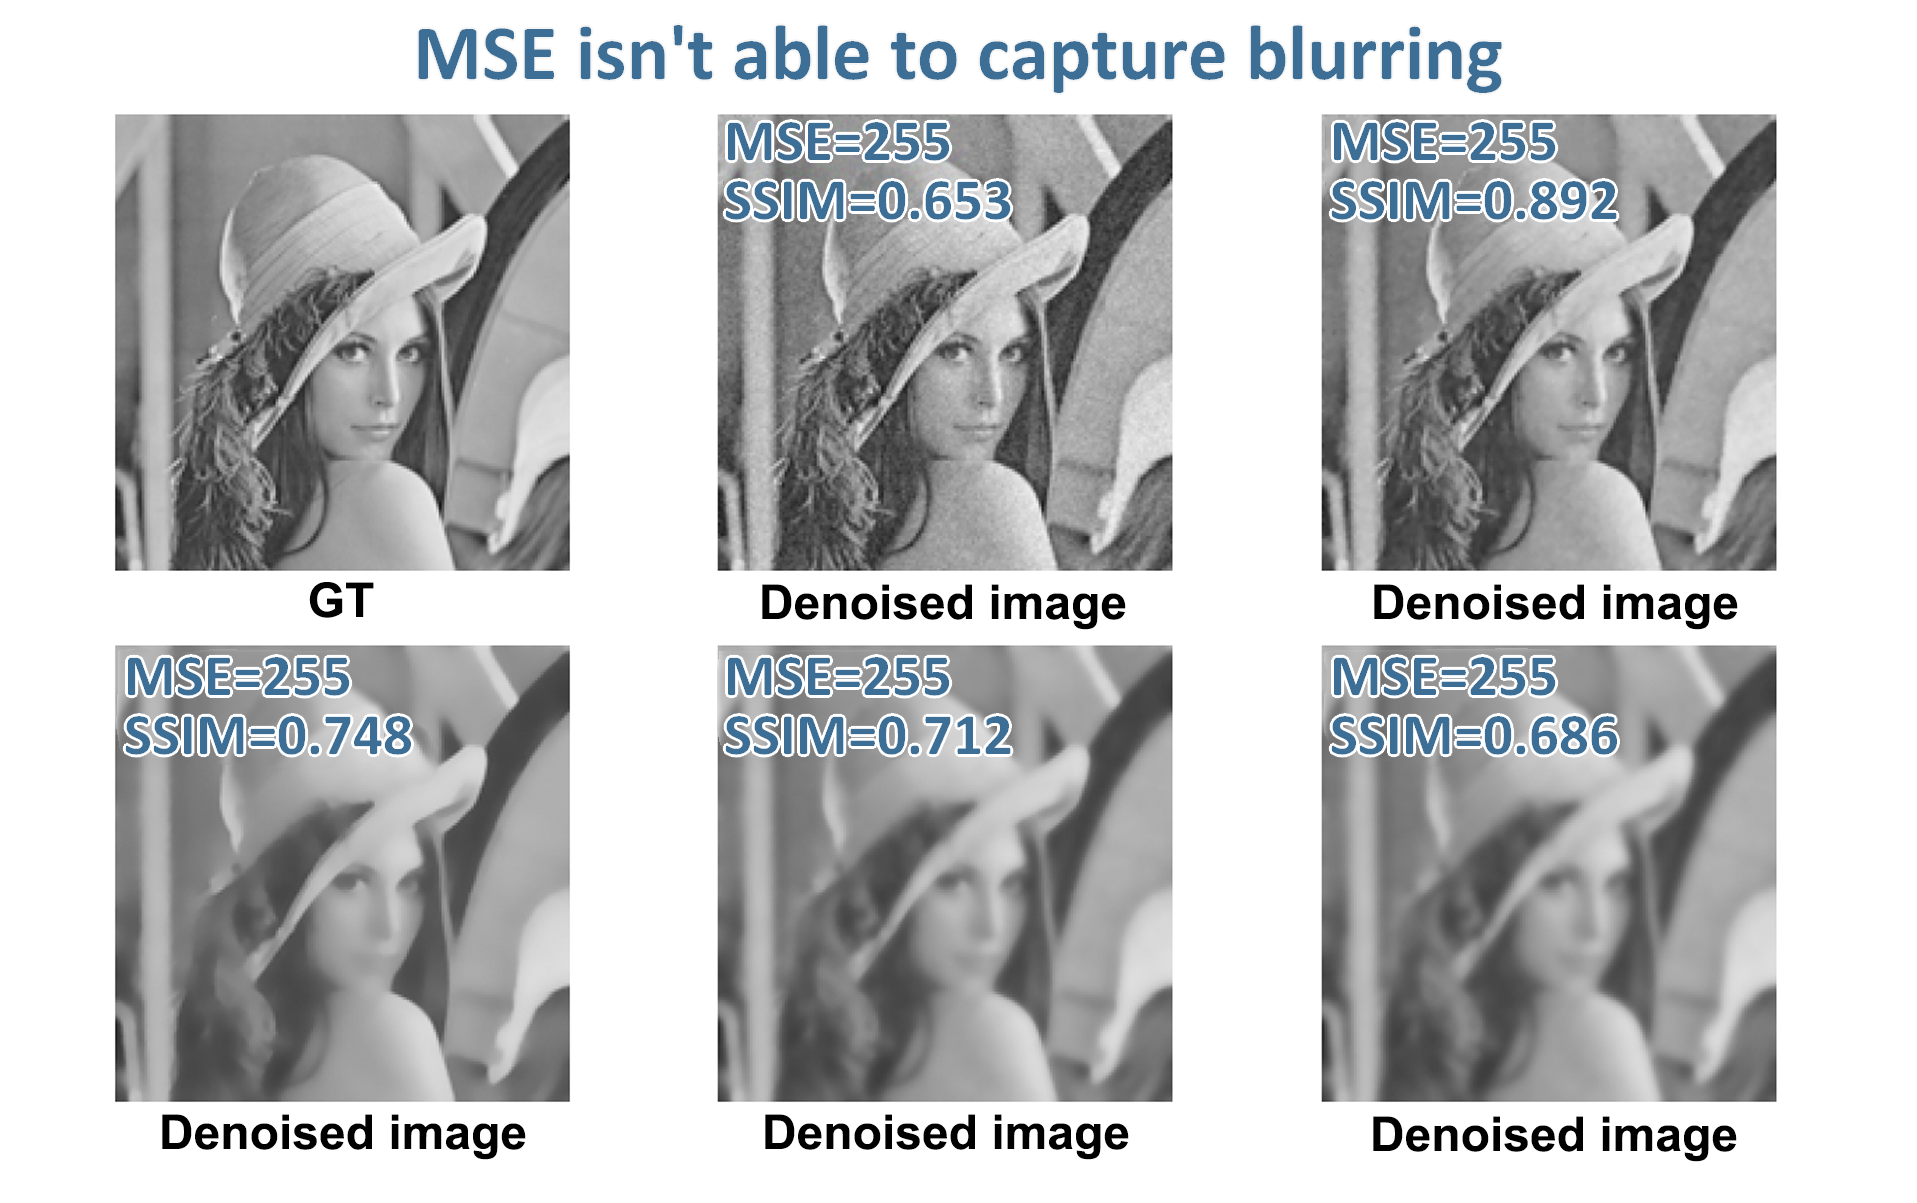
Fig. 7. Comparison of "Lena" images with different amount of blur, all with MSE=255
SSIM's ability to estimate the amount of blur was discussed in the article [6]. We see a high correlation overall, but between images with SSIM=0.73 and SSIM=0.74, it is not immediately clear that they are about the same in terms of blurring. Most people would say that the image with SSIM=0.74 is more blurred.
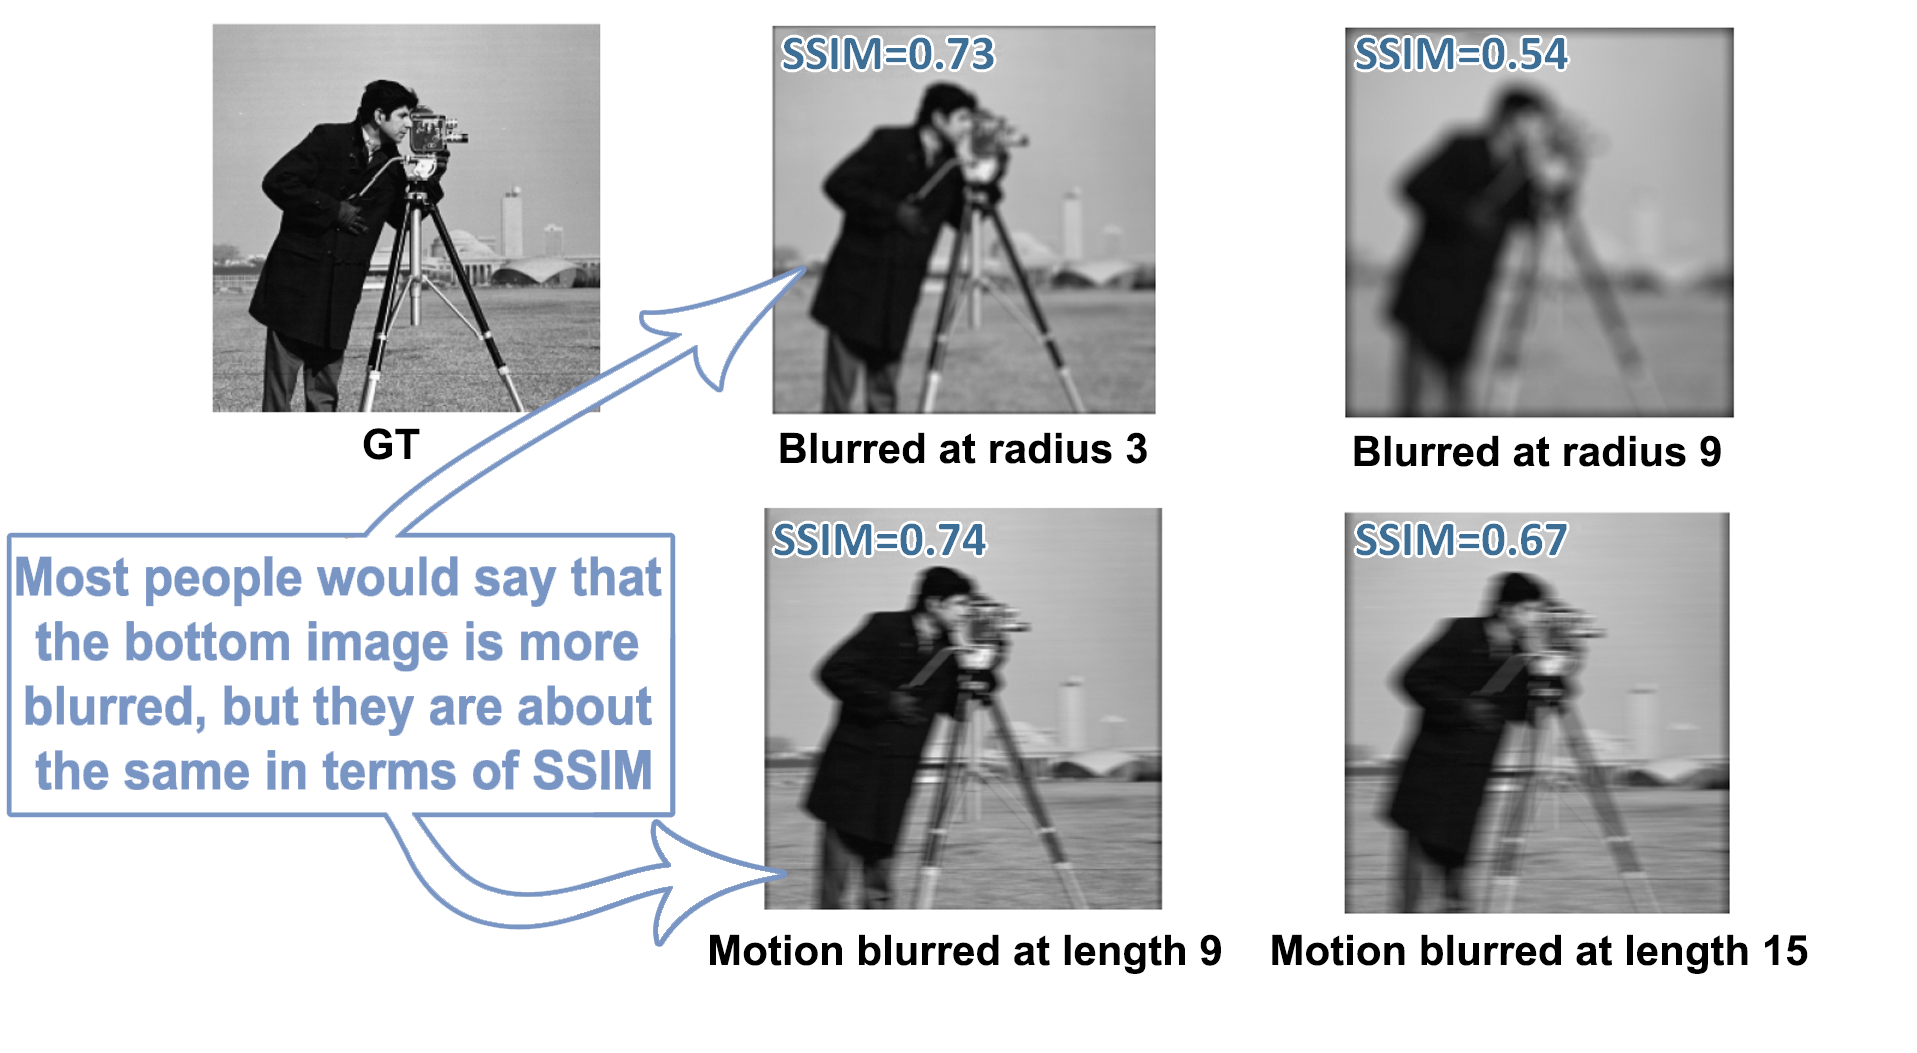
Fig. 8. Comparison of "Cameraman" images with different amount of blur
In [7] it has been demonstrated that DISTS and LPIPS metrics are superior to the other IQA (image quality assessment) models in the task of deblurring, when they are used as an objective for optimizing DNNs (deep neural networks).
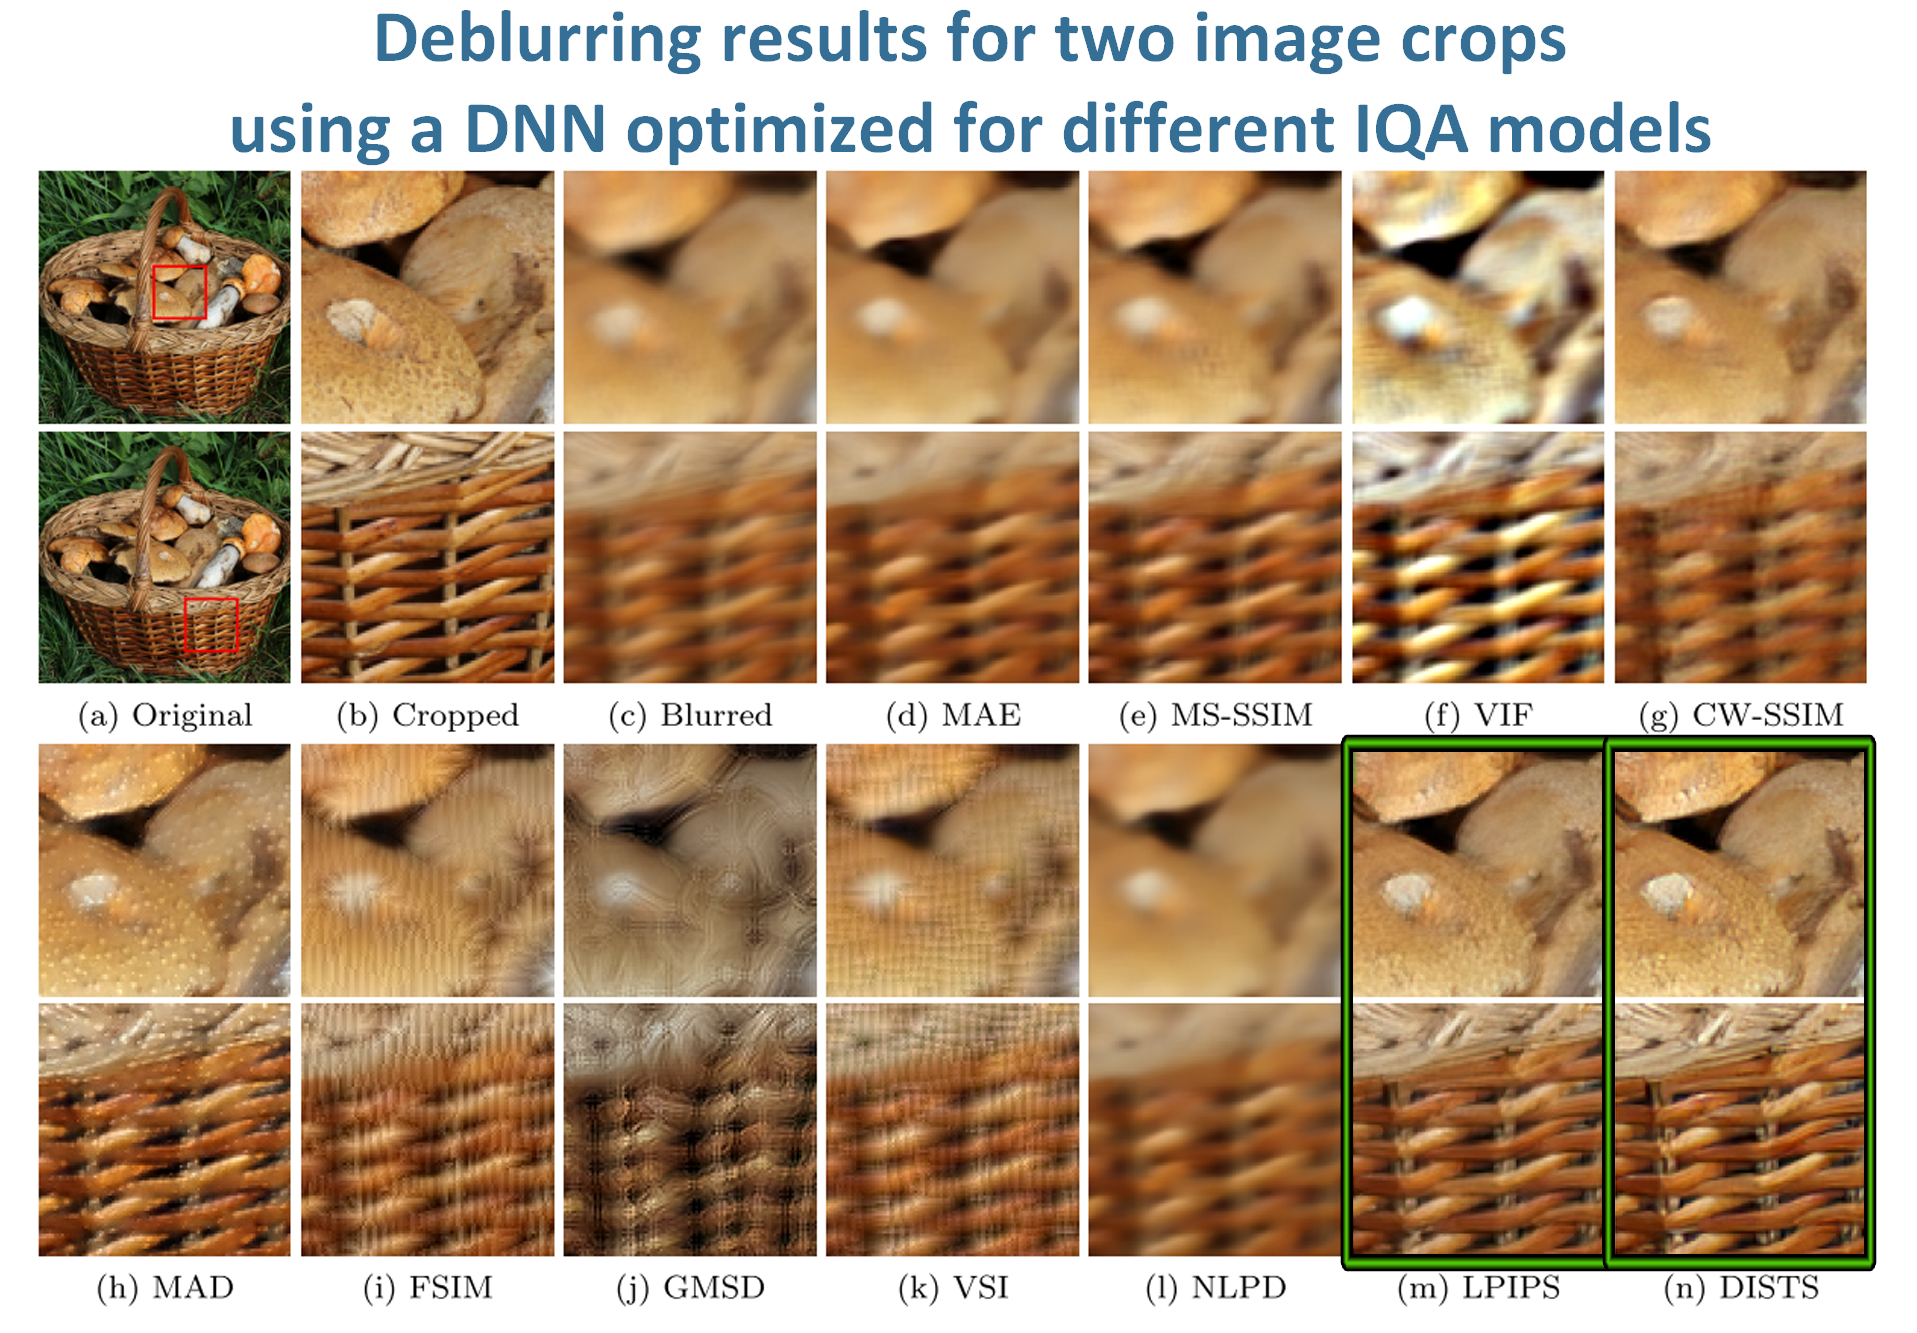
Fig. 9. Comparison of images recovered from blurred images by optimizing different IQA models. The best results are highlighted in green
Noise
In the article [2] the comparison of MAE and SSIM maps for noisy images is presented. The energy distribution of the MAE is uniform, hence all image pixels are treated equally in the formulation of the MSE. However, the perceived noise level is a space-variant (noise in smooth-intensity regions appears rather severe, yet is visually negligible in other regions containing patterns and textures), which is reflected in the SSIM map.
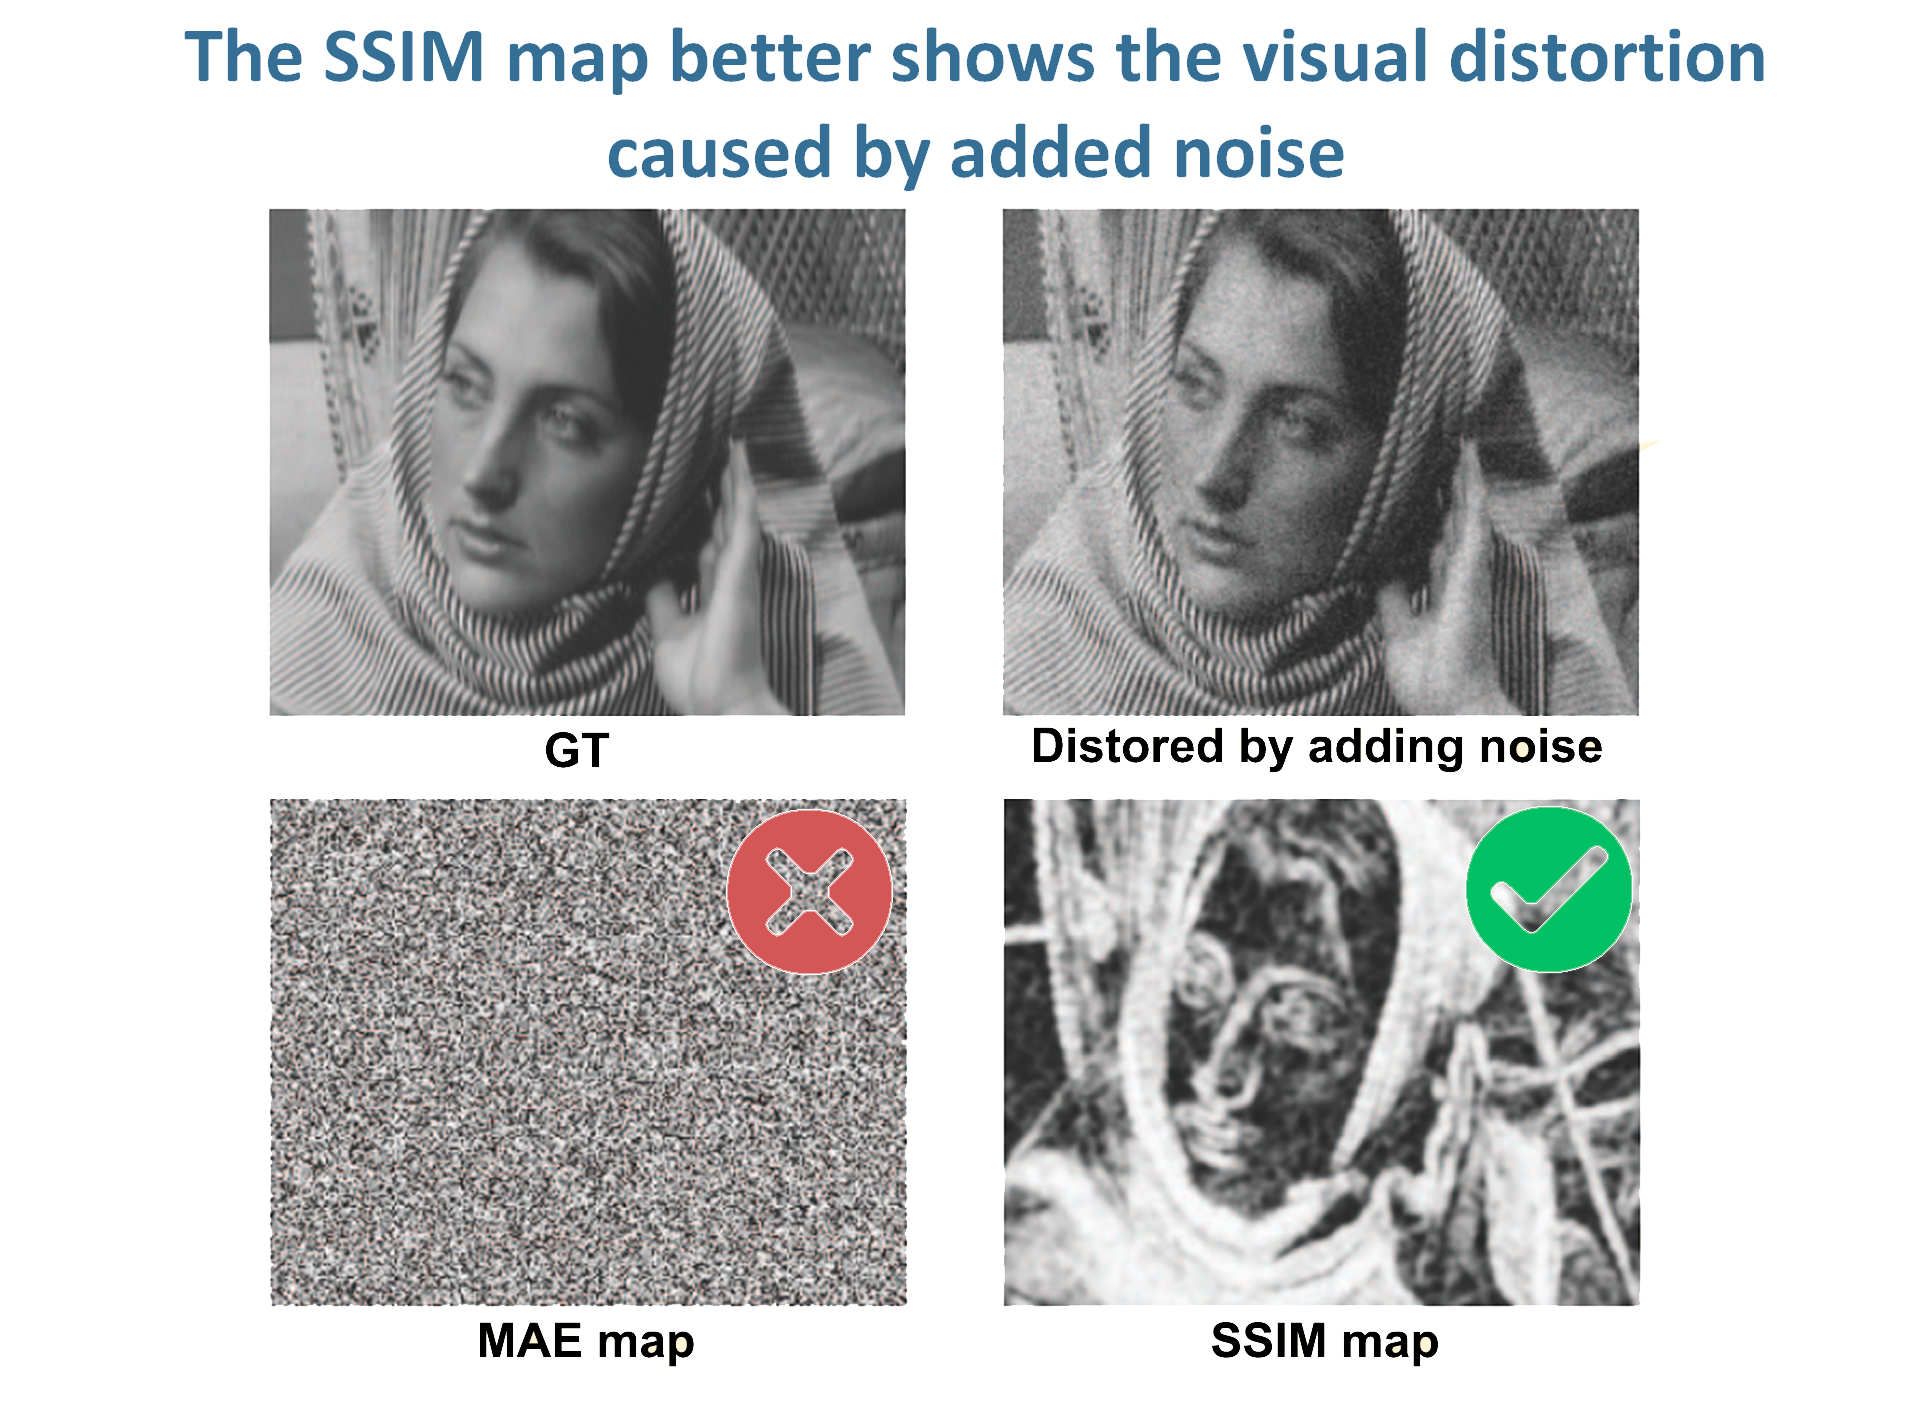
Fig. 10. Comparison of MAE and SSIM maps for noisy image
In [3] experimental comparison of PSNR and SSIM dependencies on the Gaussian noise is presented. Introduction of Gaussian noise of only 10% causes quite a large decrease of both PSNR and SSIM metrics.
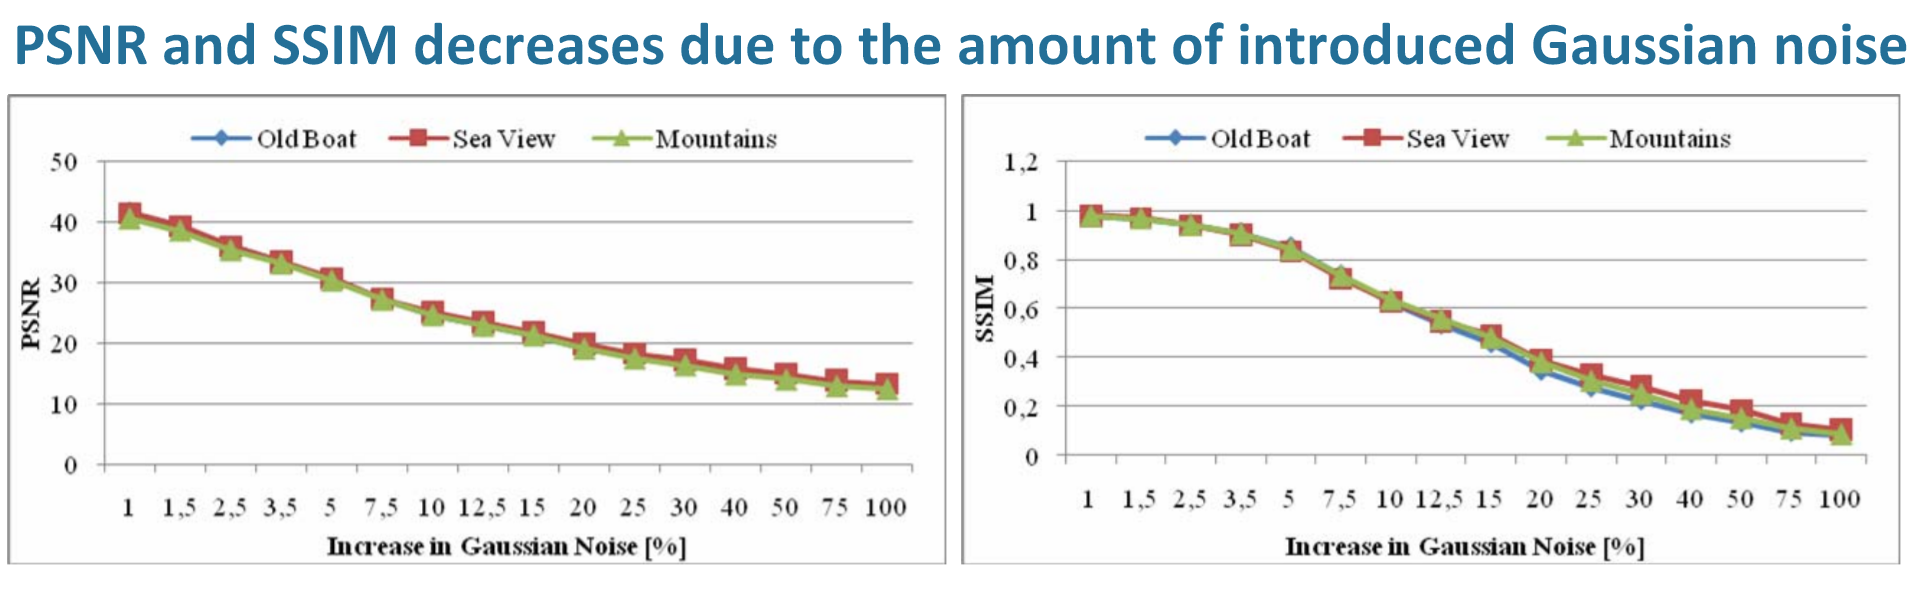
Fig. 11. Comparison of PSNR and SSIM decreases due to increase in gaussian noise
In [7] it has been demonstrated that MS-SSIM is superior to the other IQA (image quality assessment) models in the task of denoising (and has almost identical performance with MAE), when it is used as an objective for optimizing DNNs (deep neural networks).
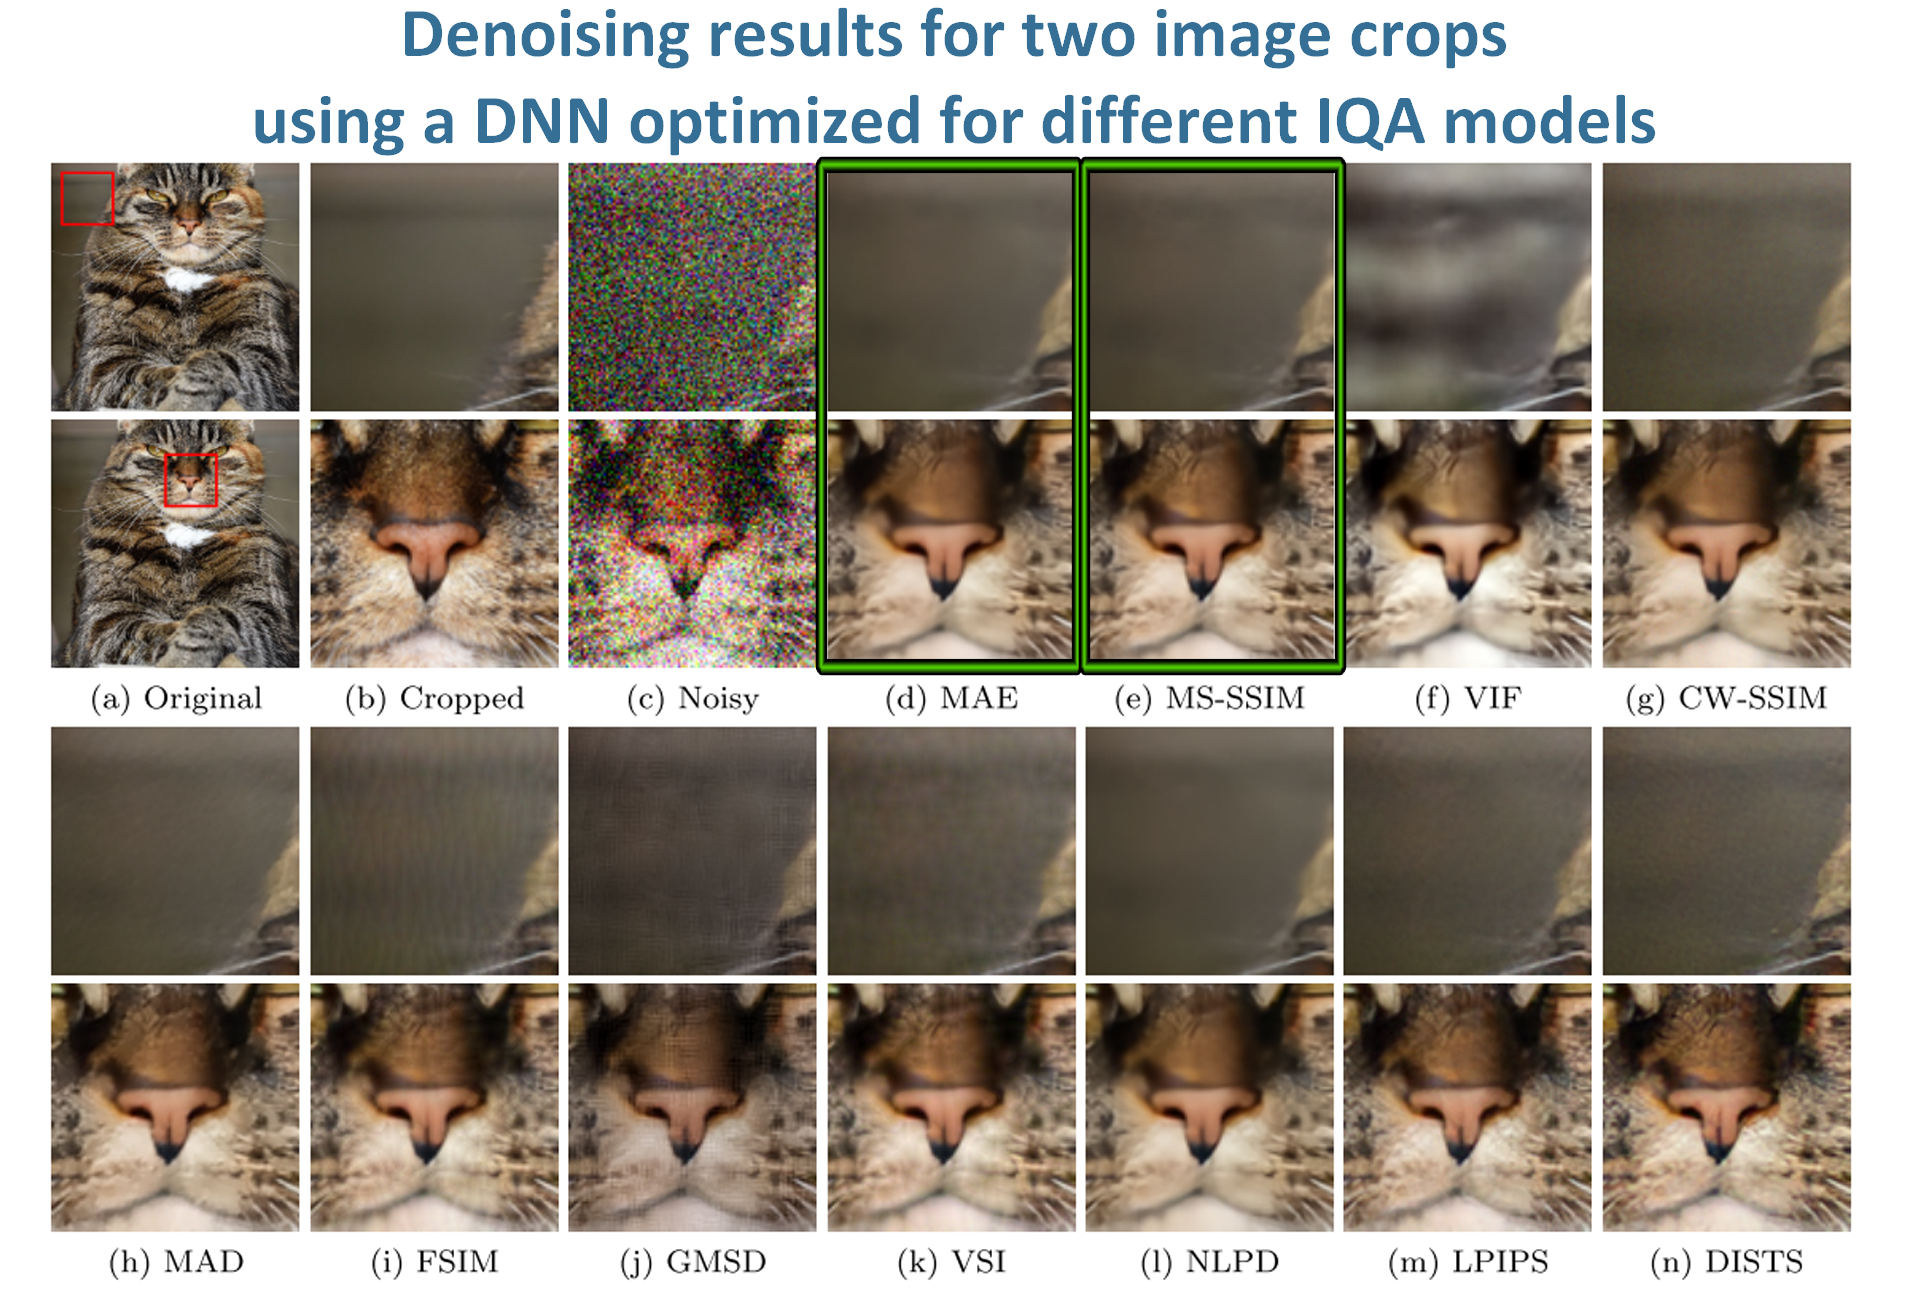
Fig. 12. Comparison of images recovered from noisy images by optimizing different IQA models. The best results are highlighted in green
Changes in brightness, contrast, hue and saturation
All these types of distortions aren't structural. Therefore, it can be assumed that the SSIM poorly catches them, which may or may not be good in particular situations.
Confirmation of this statement is presented in [3] in the form of experimental comparisons of PSNR and SSIM dependences on the changes in brightness and hue. These charts clearly describe the shortcomings that PSNR has. Little changes in brightness and hue have negligible influence on the visual quality and, as it can be seen, on SSIM scores. While for PSNR the opposite is true.
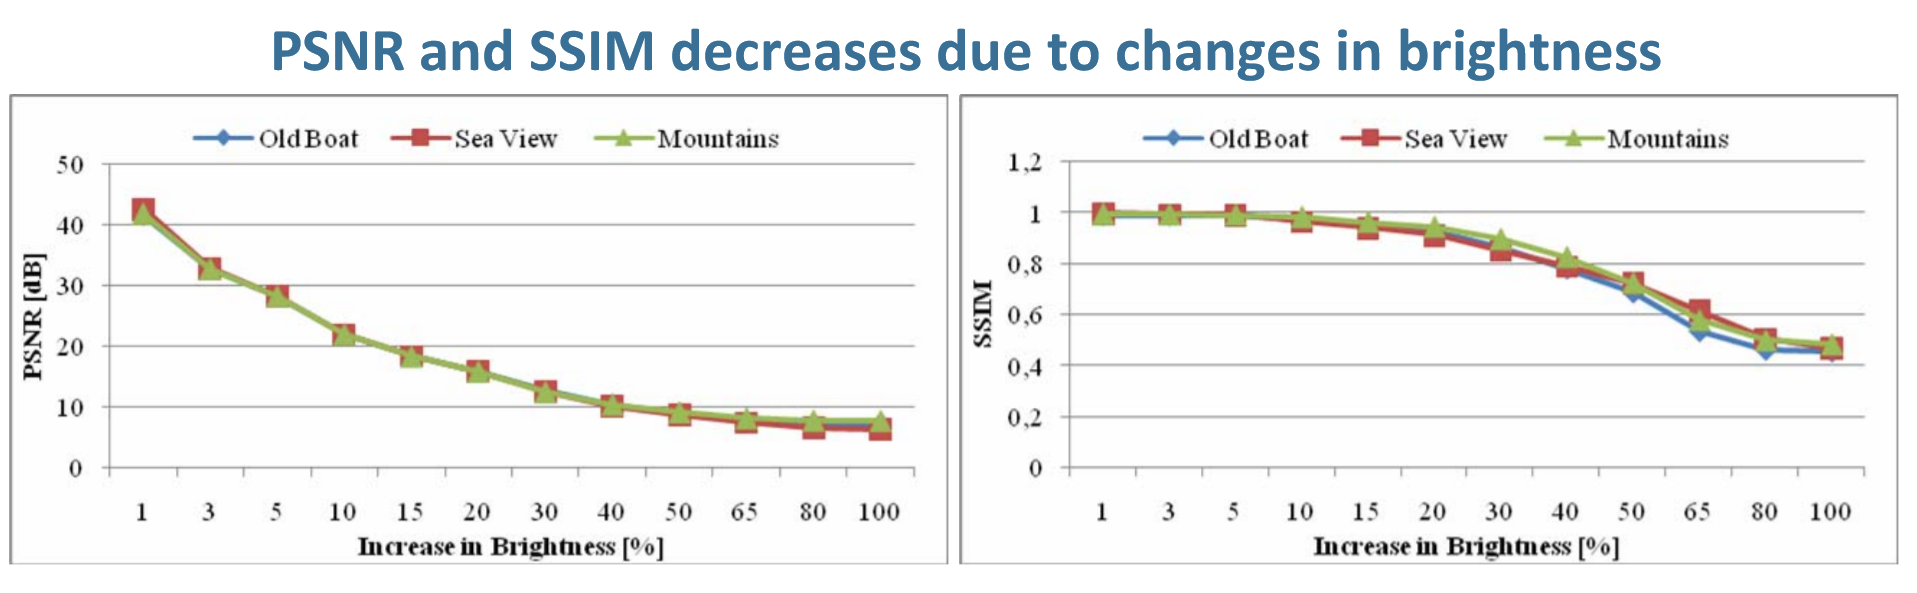
Fig. 13. Comparison of PSNR and SSIM decreases due to changes in brightness
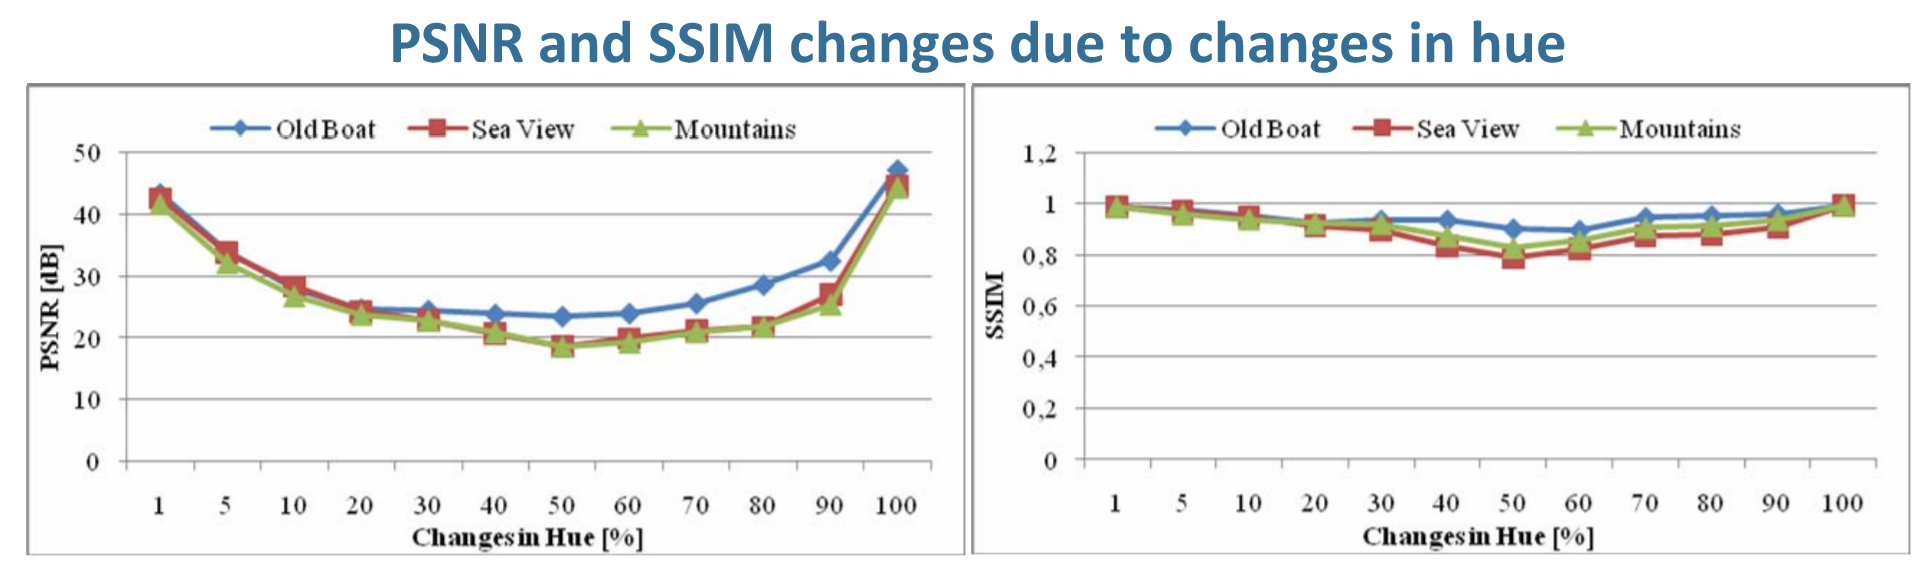
Fig. 14. Comparison of PSNR and SSIM changes due to changes in hue
Compression
Image compression algorithms traditionally optimize the MSE under the constraint of a limited file size.
In the paper[8] it has been shown that PSNR can be used as a metric when the content and codec are fixed across the test conditions, e.g. in comparing codec optimization settings for a given video content, but PSNR is an unreliable metric when content isn't fixed. When each video is considered individually, PSNR and subjective quality always increase monotonically with bit rate (more examples in the article). But there is an example where PSNR would indicate that the quality for SRC3 is always higher than the quality of SRC9 at all bit rates, while subjective data shows that this is not true.
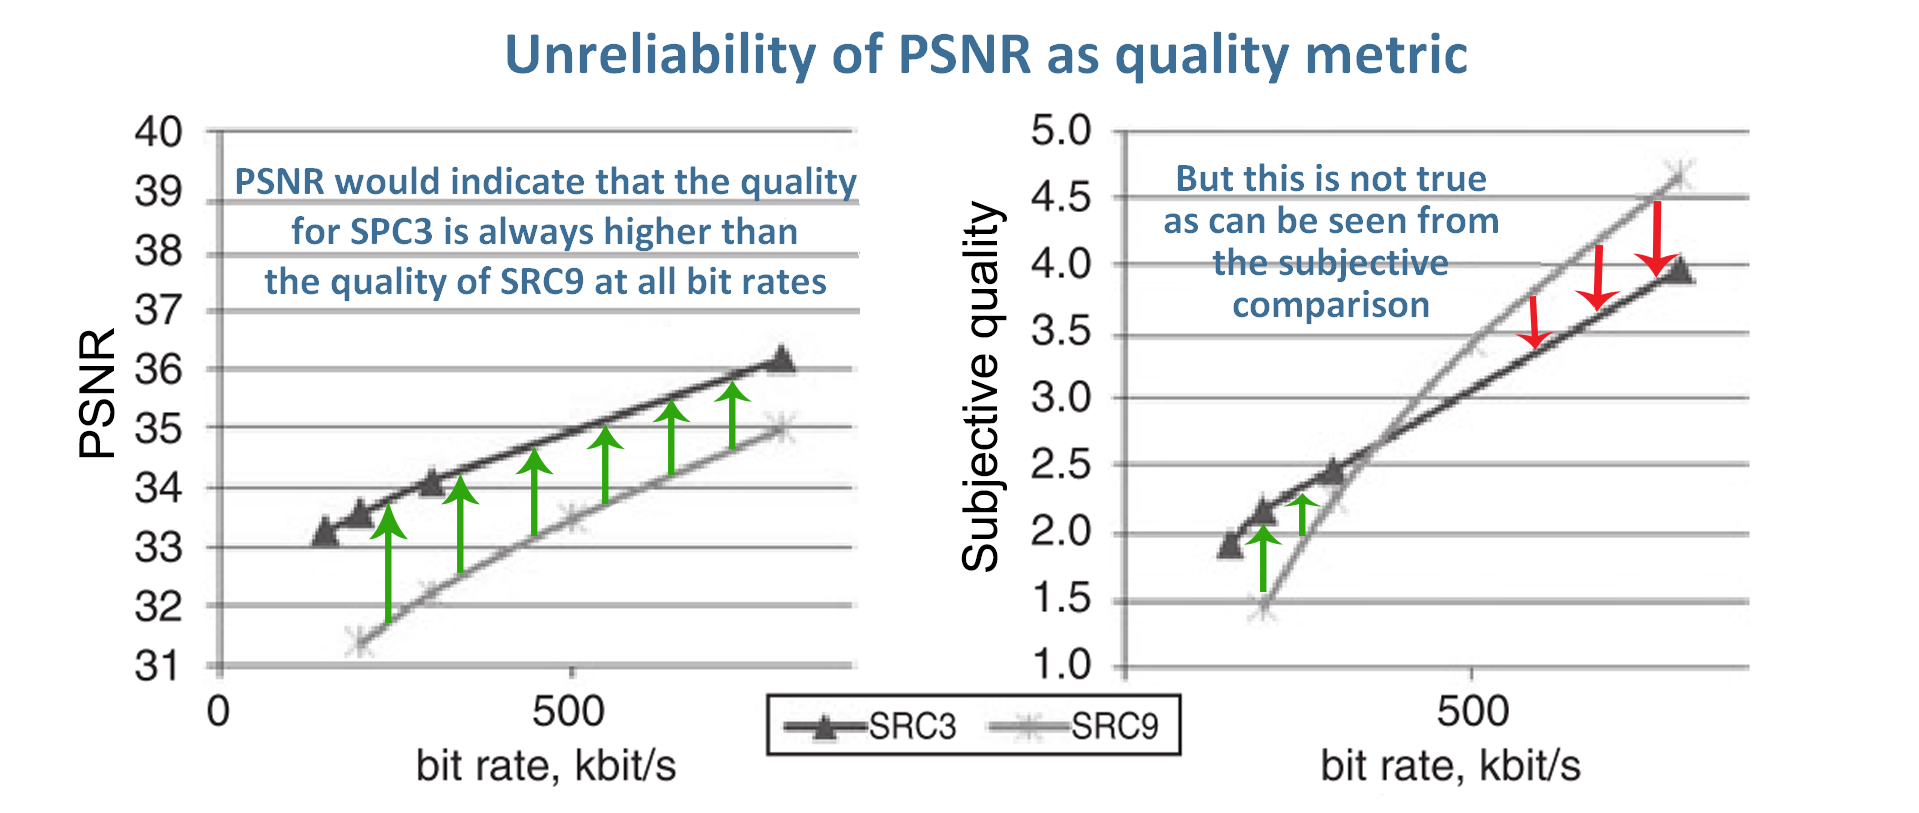
Fig. 15. PSNR and subjective quality variation with bit rate, across contents
Also in that article it has been demonstrated that the correlation between PSNR and subjective quality gets worse if PSNR is used across contents, than if PSNR is used for each video separately. It means, although the monotonic relationship between PSNR and subjective quality exists separately per content, it does not exist across contents.
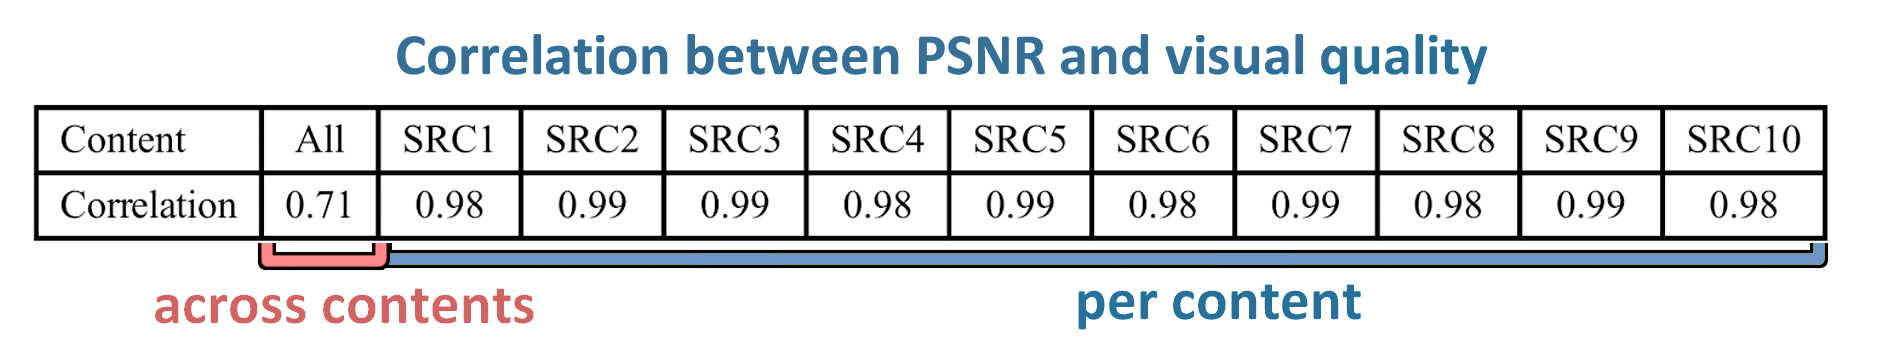
Fig. 16. Correlation between PSNR and quality per content and across contents
This is a well-known drawback of full-reference metrics usage for different content comparisons. In these cases, correlations should be aggregated across content using Fisher transform, or the comparison should be performed with no-reference metrics.
In the article [2] the comparison of MAE and SSIM maps for compressed images is presented. There are annoying pseudo-contouring effects (in the sky region) and blocking artifacts (along the boundaries of the building) on the compressed image. These distortions are successfully captured by the SSIM index, yet poorly predicted by the absolute error map. Since absolute error affects MSE evenly in terms of pixel distribution in space, MSE suffers from the same problem.
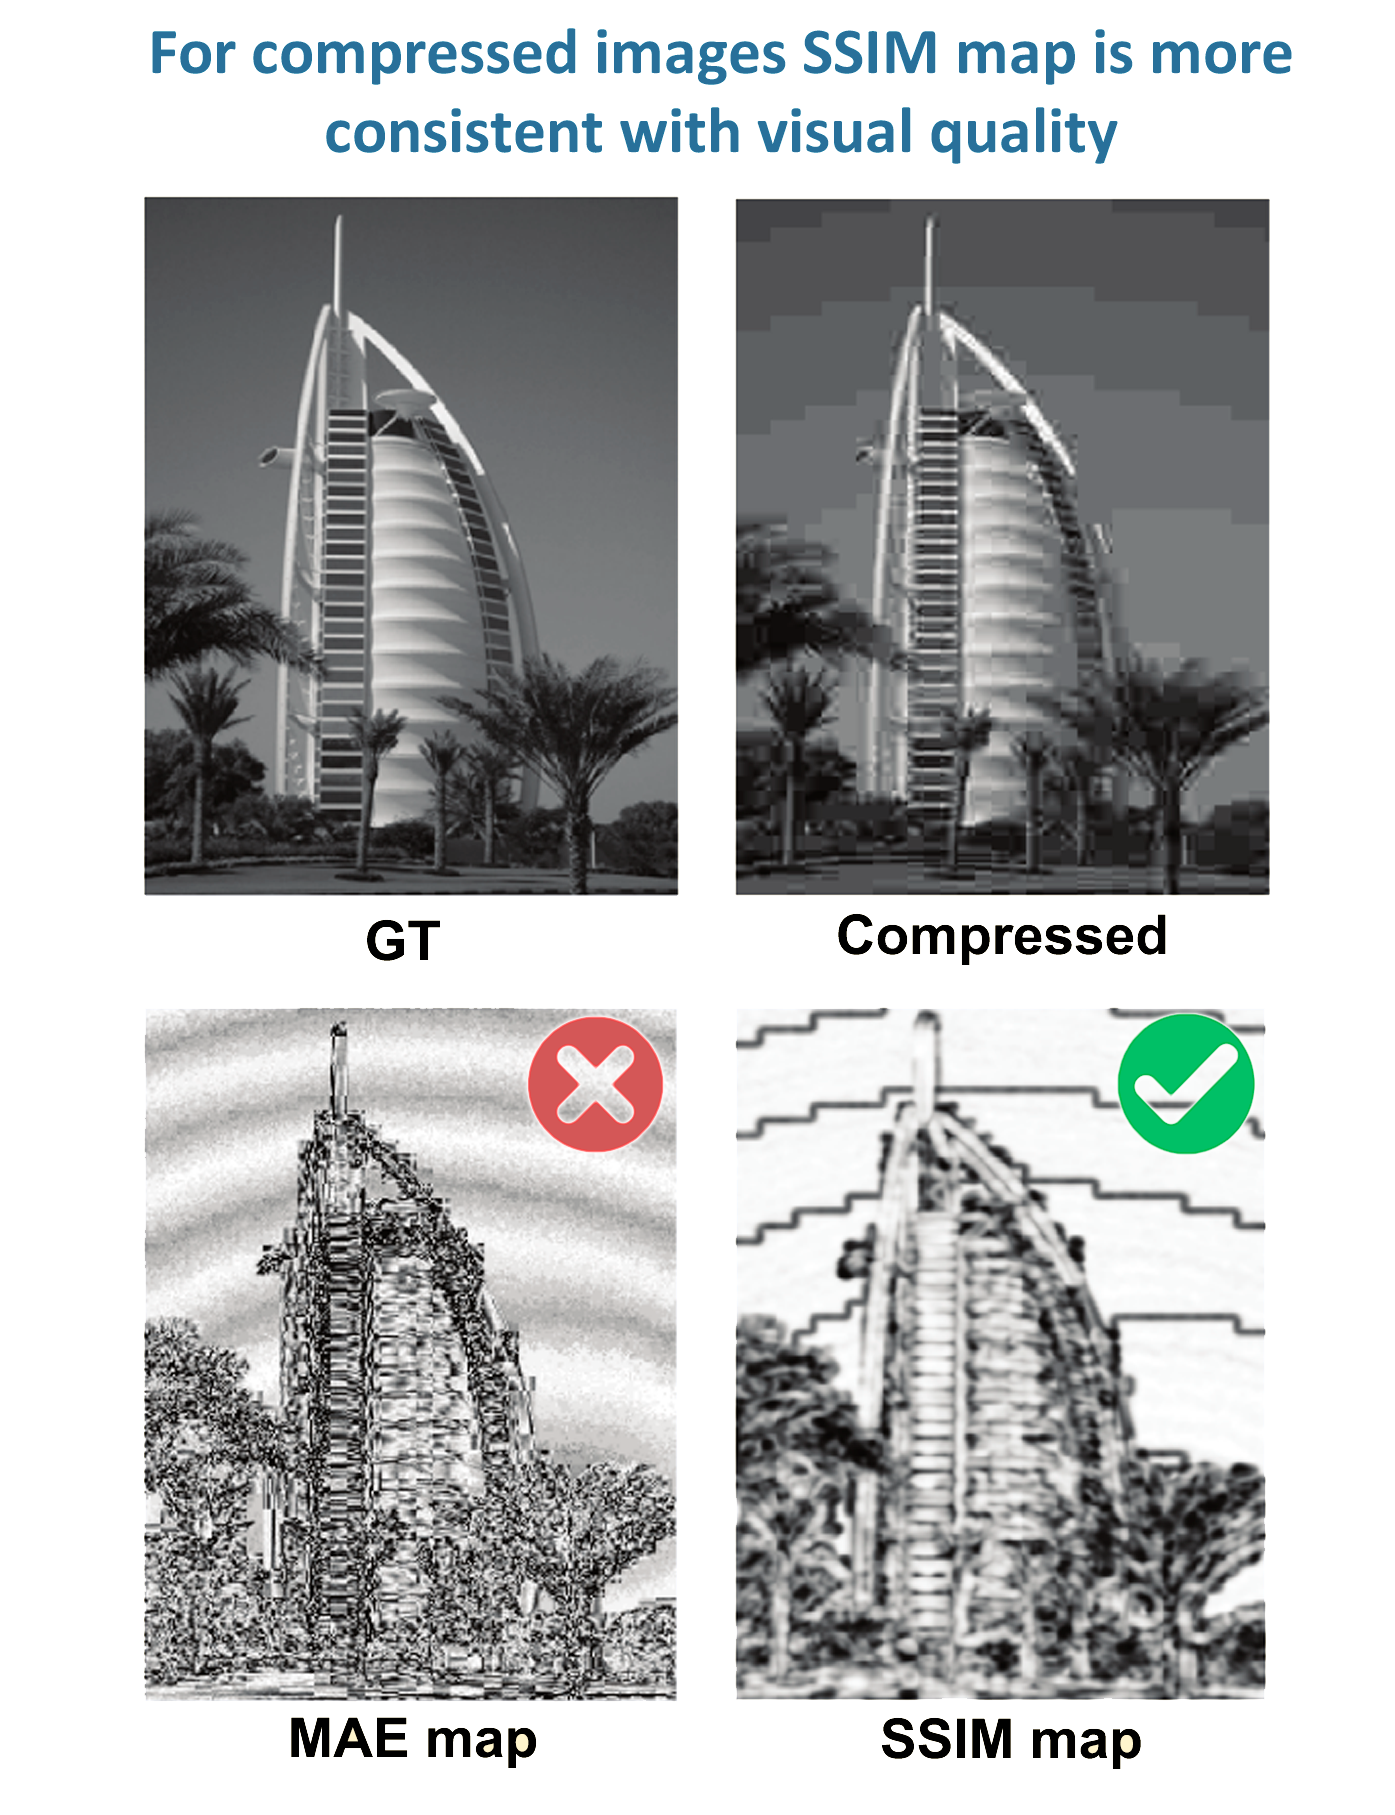
Fig. 17. Comparison of MAE and SSIM maps for compressed image
Since structural distortions occur after compression, it makes more sense to use SSIM, than PSNR.
In [7] it has been demonstrated that DISTS and LPIPS metrics are superior to the other IQA (image quality assessment) models in the task of compression, when they are used as an objective for optimizing DNNs (deep neural networks).
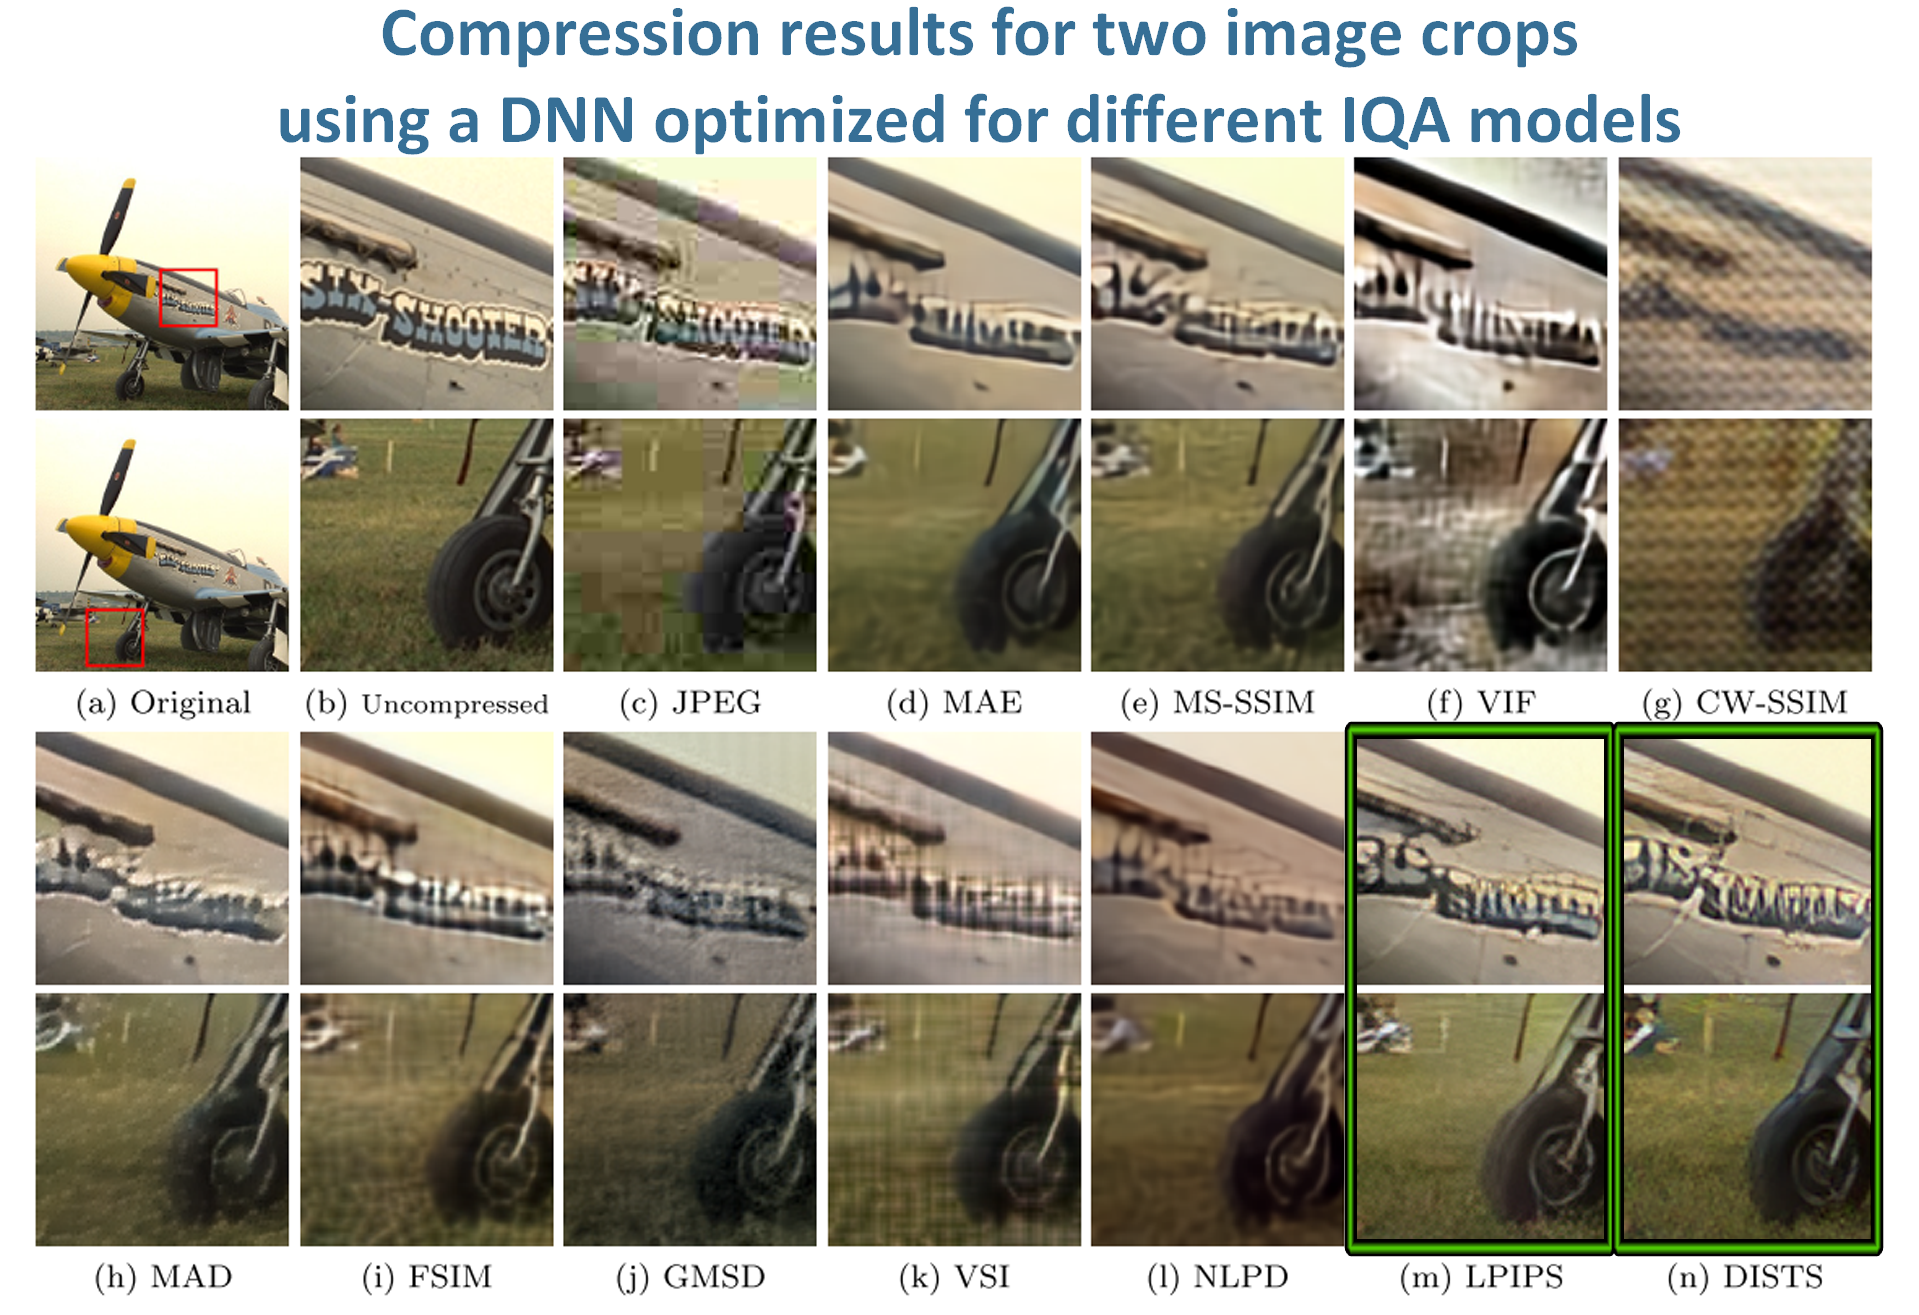
Fig. 18. Comparison of images recovered from compressed images by optimizing different IQA models. The best results are highlighted in green
Rotations and spatial shifts
As had been shown in [2], PSNR and SSIM are highly sensitive to rotations, spatial shifts and scalings.
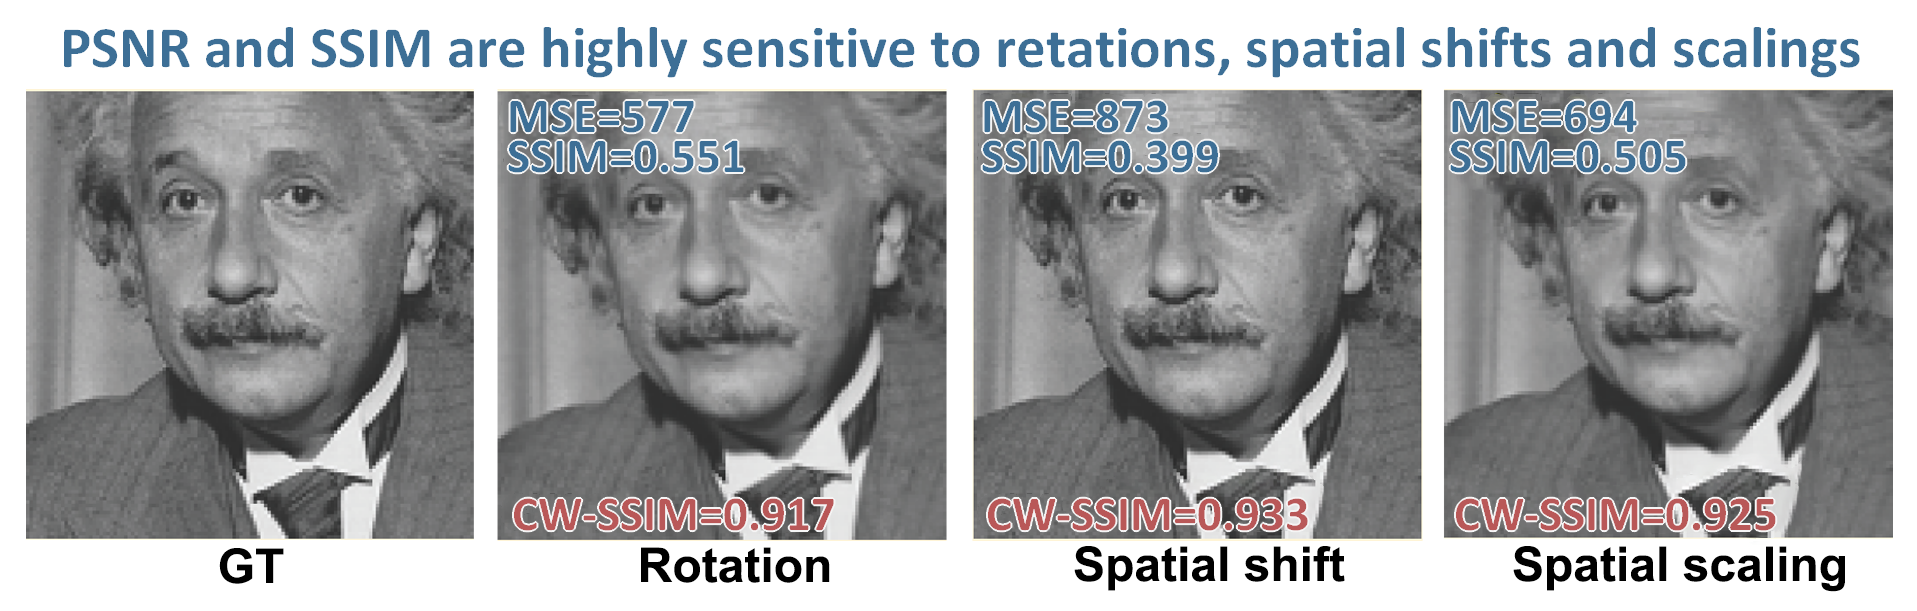
Fig. 19. Comparison of "Einstein" images with rotation, spatial shift and spatial scaling
To deal with this problem, a wavelet domain version of SSIM or CW-SSIM was developed [9]. As you can see from Fig. 19, CW-SSIM really does a better job with these types of distortions. The disadvantages of this metric should be noted. First, the CW-SSIM does not provide any correspondence information between the pixels of the two images being compared. Second, the method works only when the amount of translation, scaling and rotation is small compared to the wavelet filter size.
Super-resolution
The inapplicability of PSNR and SSIM for the SR has also been discussed in other studies [10], [11].
Our examples of the inapplicability of the PSNR and MS-SSIM for the SR are presented below. As often happens, the SR algorithms produce pixel shifts and as result in pure form PSNR and SSIM give bad scores. To avoid this problem, a shifted version of the metrics is often used, and our benchmark is no exception [12]. However, even with shift compensation, most metrics have a low correlation with subjective assessment.
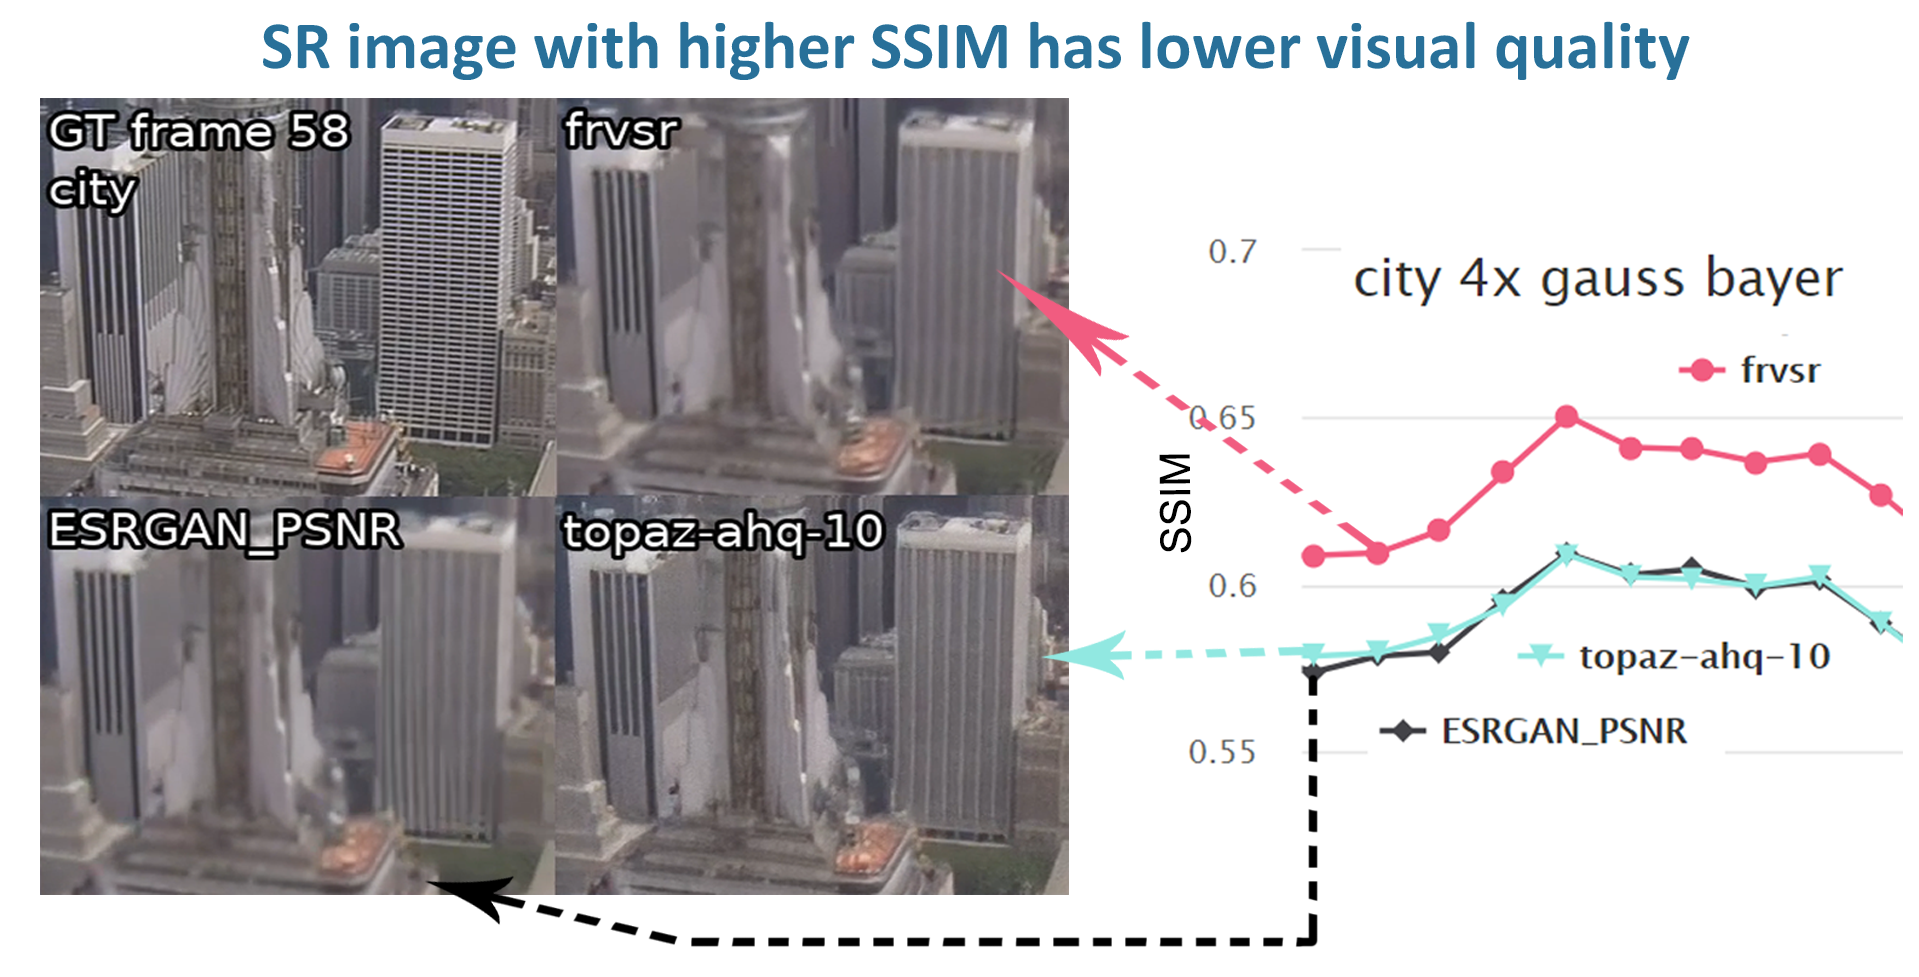
Fig. 20. Our examples of SSIM negative correlation with visual quality for Super-Resolution task
Subjective comparisons were made using Subjectify.us on cropped video clips to make it easier for respondents.
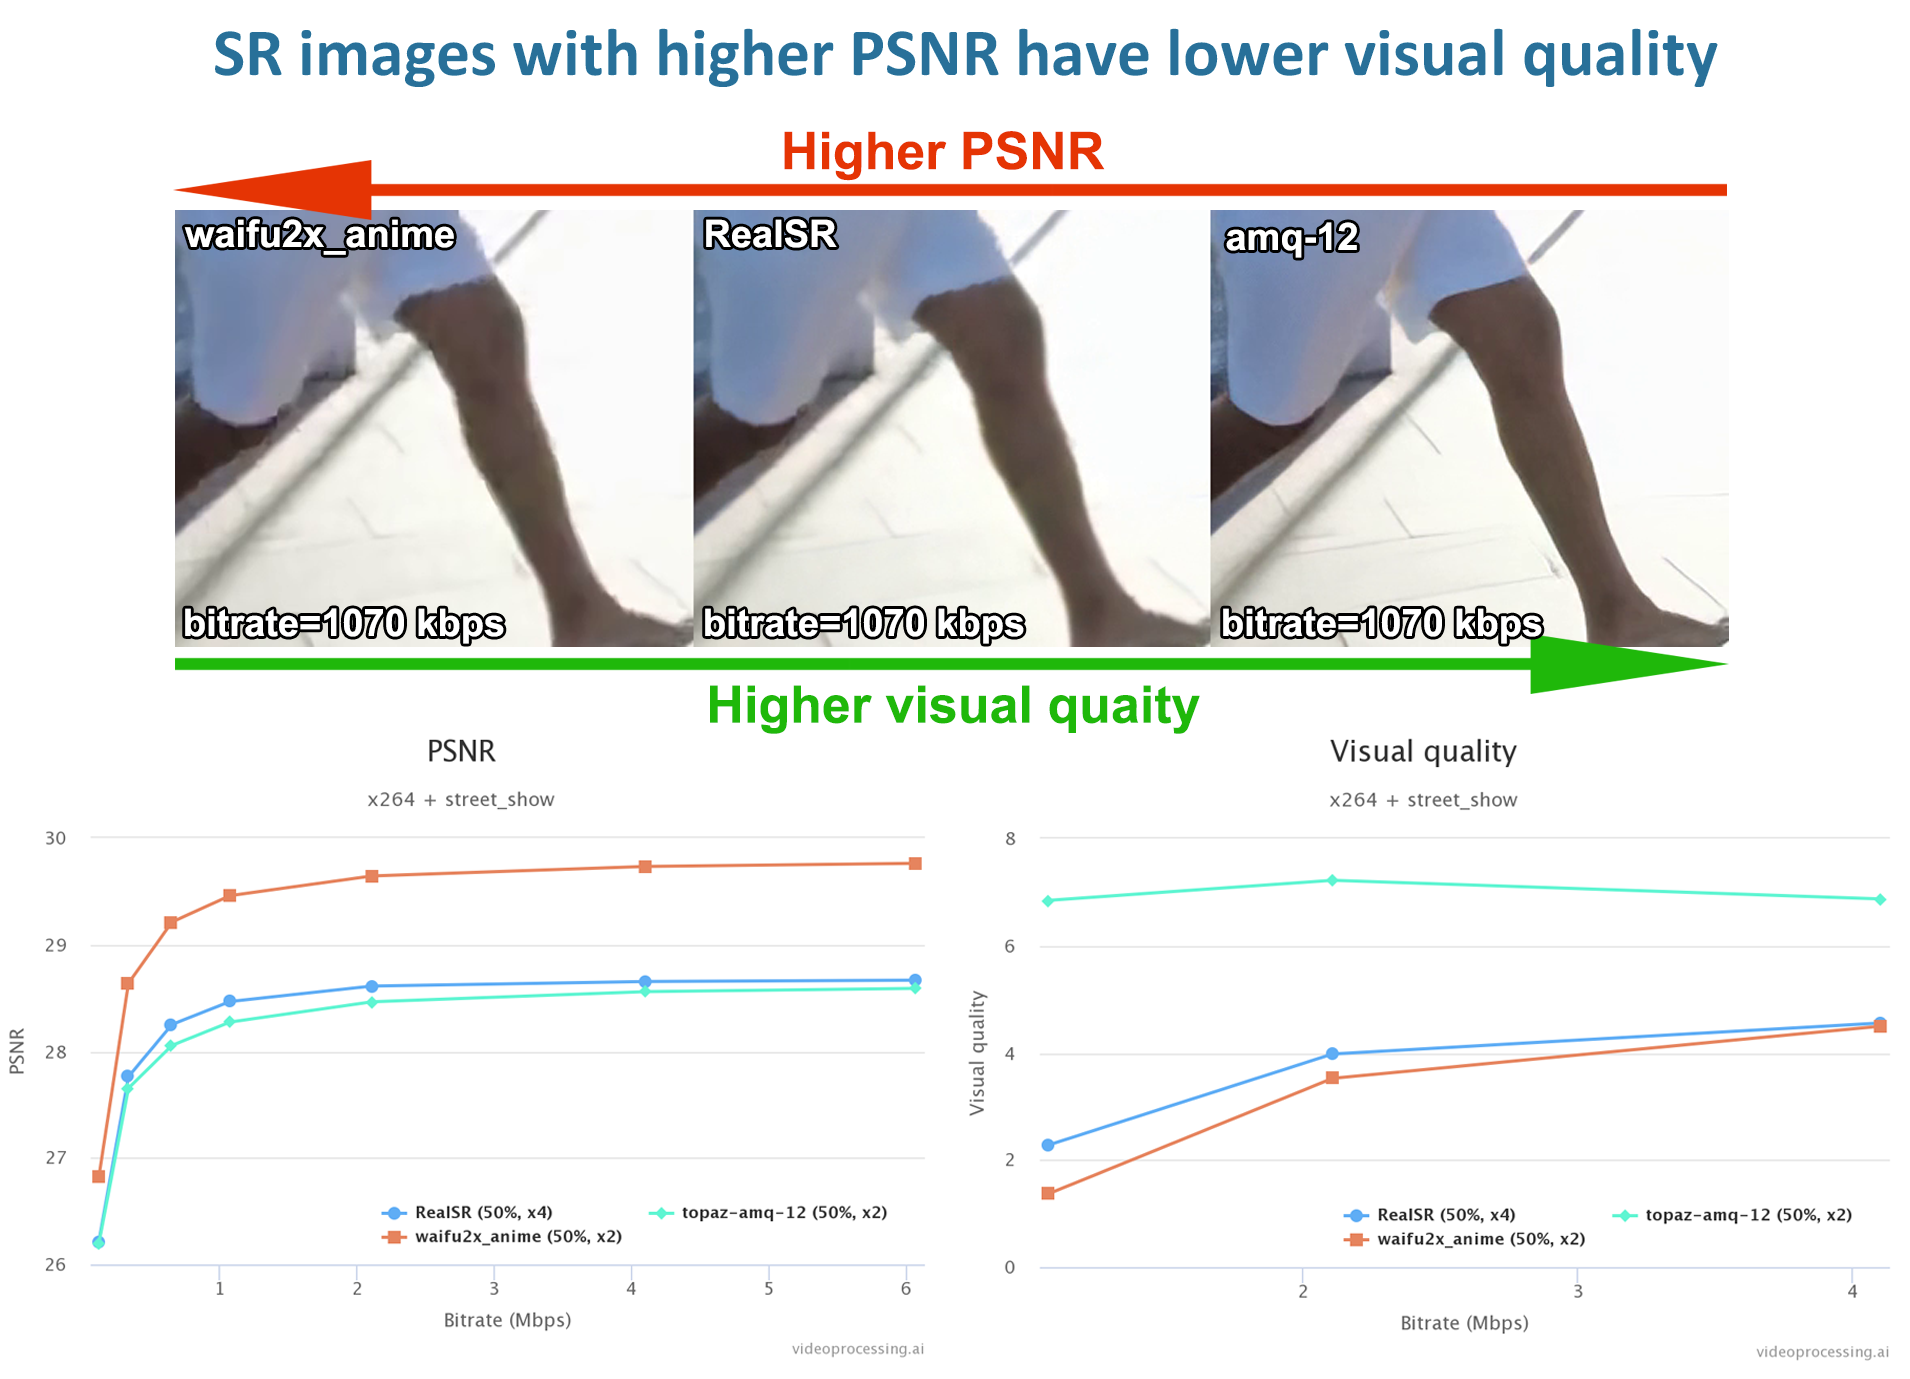
Fig. 21. Our examples of PSNR negative correlation with visual quality for Super-Resolution task
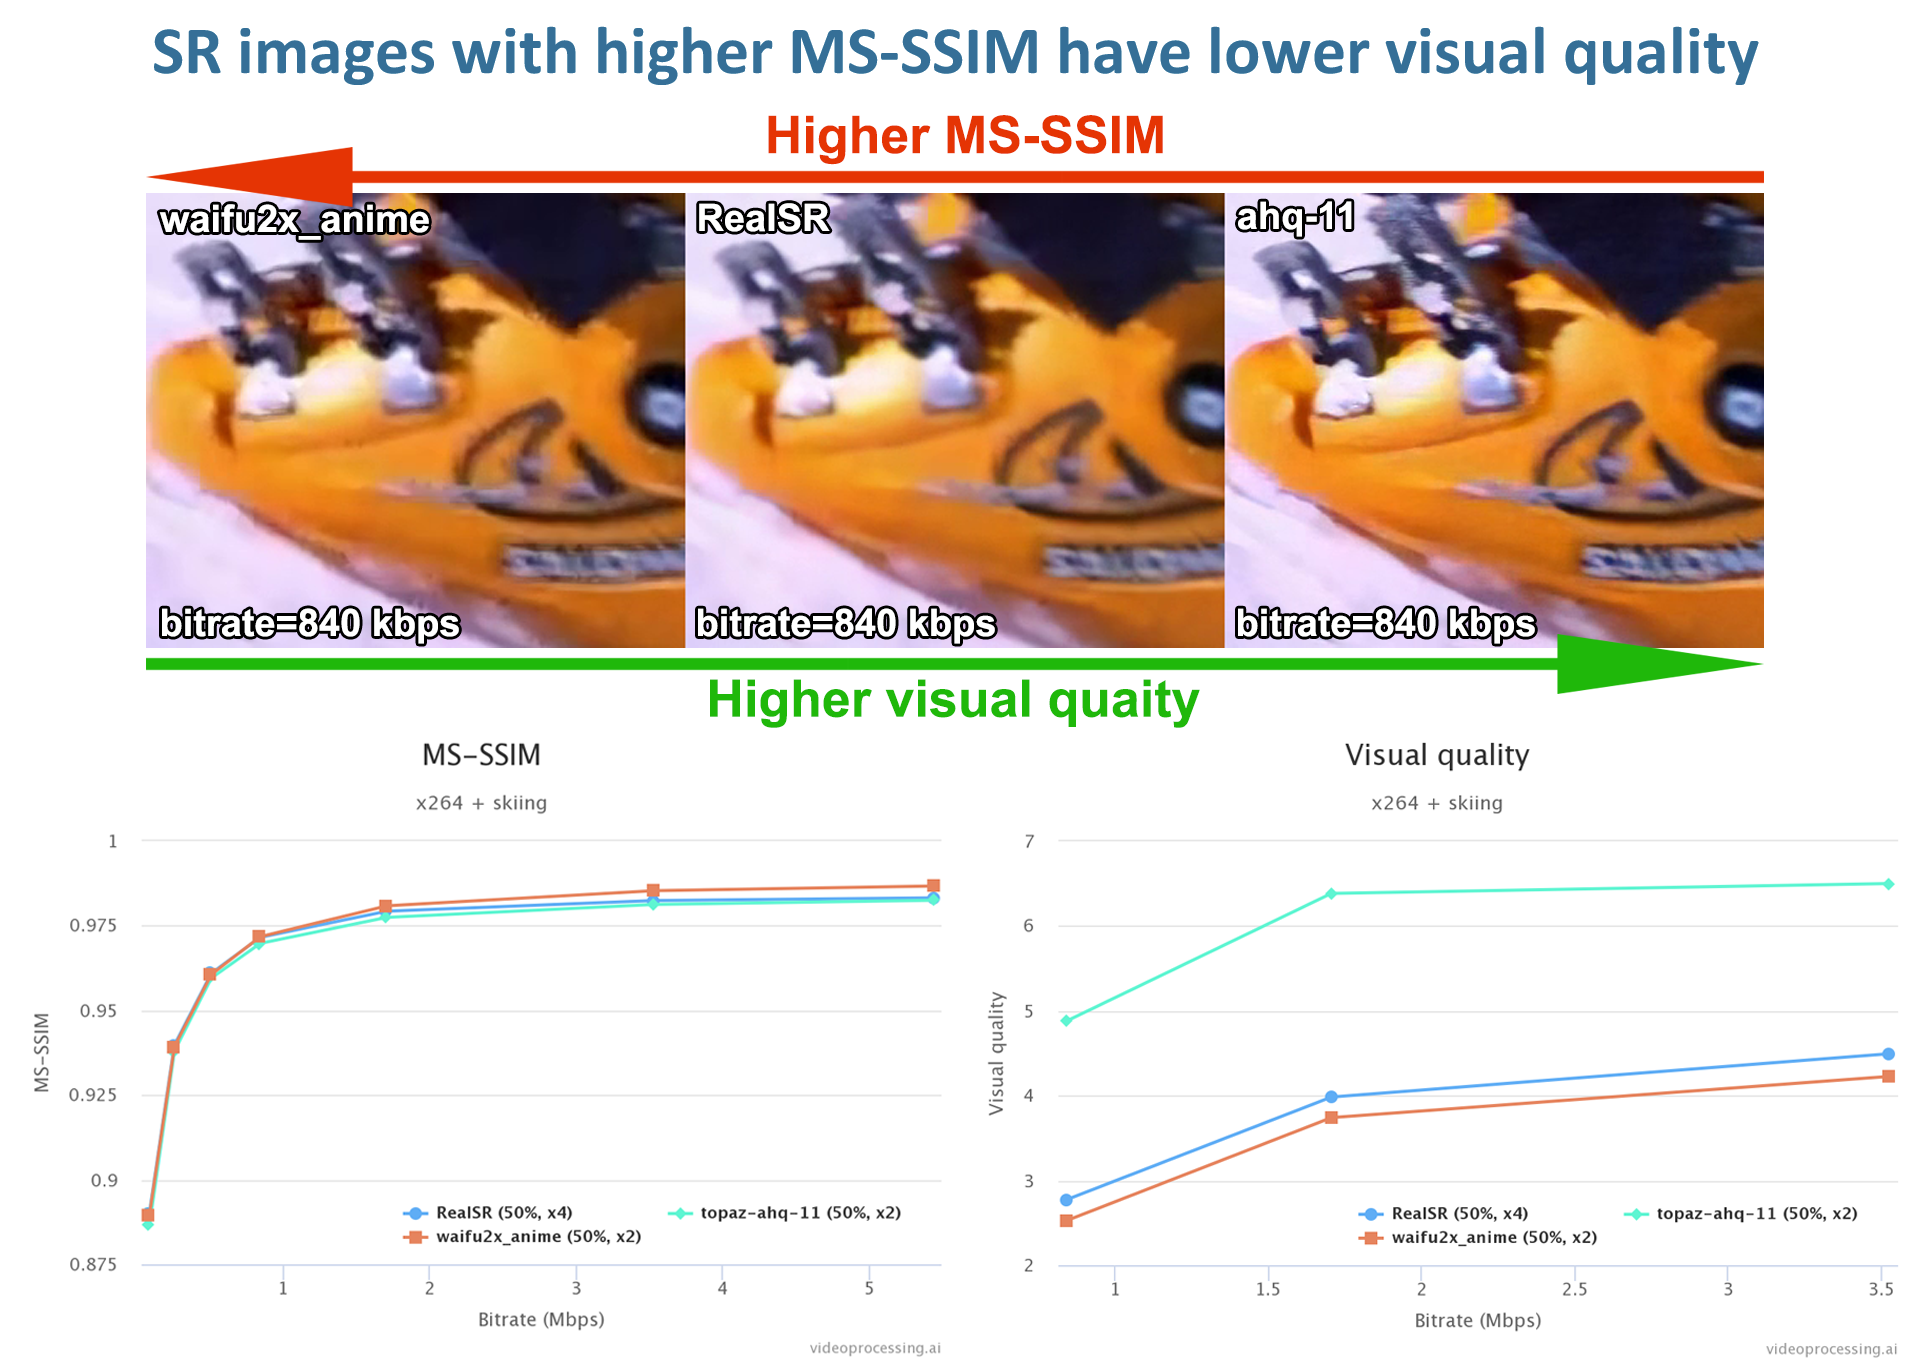
Fig. 22. Our examples of MS-SSIM negative correlation with visual quality for Super-Resolution task
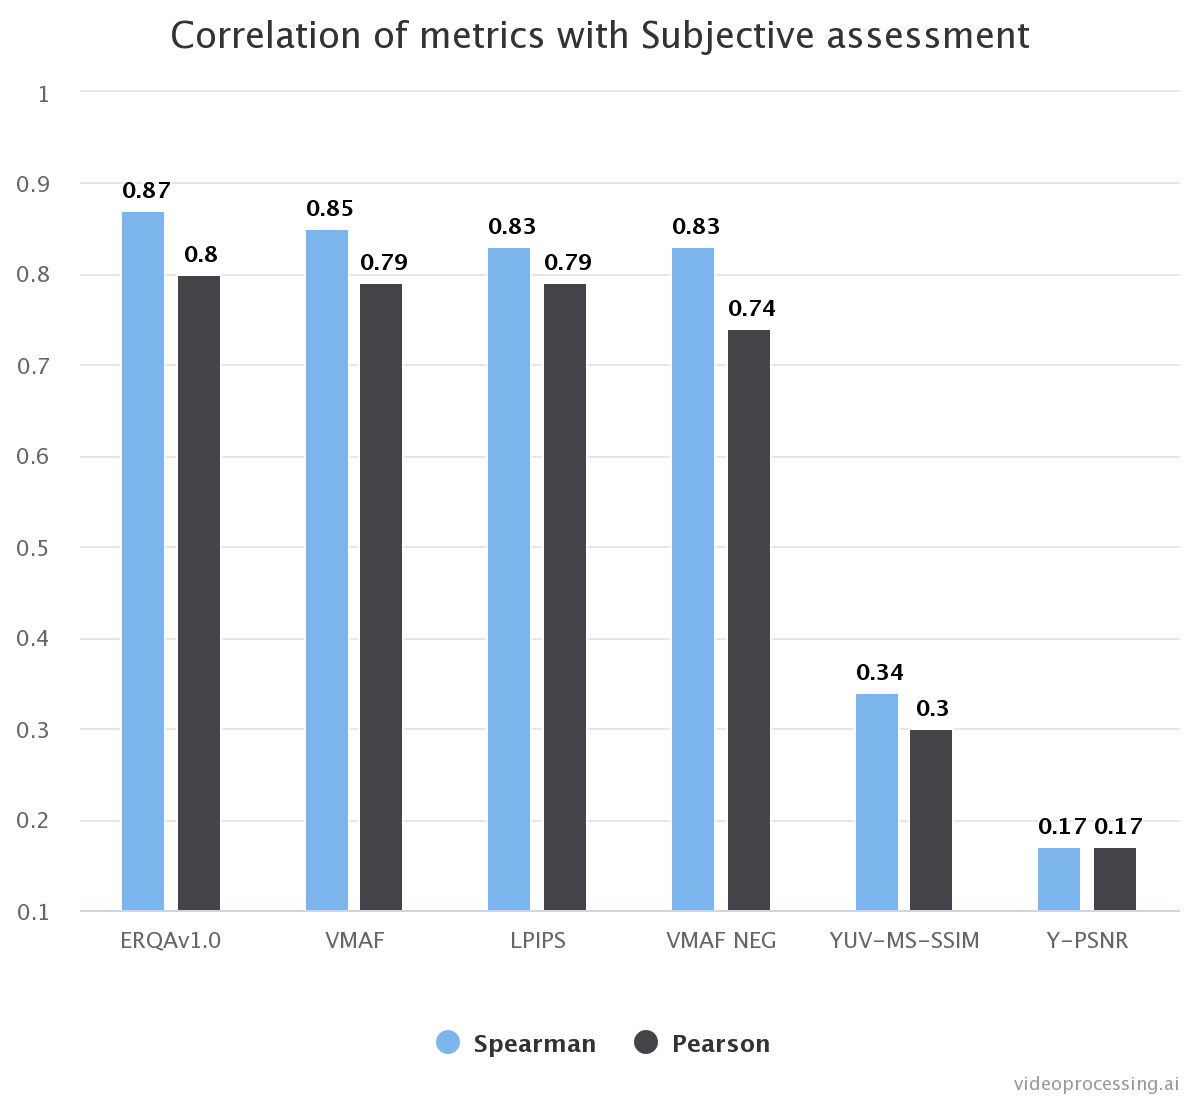
Fig. 23. Our result of analyzing the correlation of metrics with subjective quality for Super-Resolution tasks. The ERQA metric was developed specifically for the benchmark VSR [12]
Crops for subjective comparison and correlation of metrics are taken from the Super-Resolution for Video Compression Benchmark.
Currently, there is no metric to verify the ability of SR to restore real details. We are working on this issue and developing our own metric for the task of Super-Resolution as well as assessing SR's ability to recover video after compression. As you can see from Fig. 23, ERQA is superior to other metrics in terms of correlation with subjective assessment.
Conclusion
It can easily be concluded that the PSNR metric is not a good metric for quality estimation. There are too many parameters that highly influence the PSNR value and barely affect the visual quality (for example little changes in brightness, contrast, hue and saturation). On the other hand, SSIM metric has quite better performance compared to PSNR. But SSIM is almost insensitive to changes in brightness, contrast, hue and saturation.
In general, the number of newly created image quality metrics rises every year.
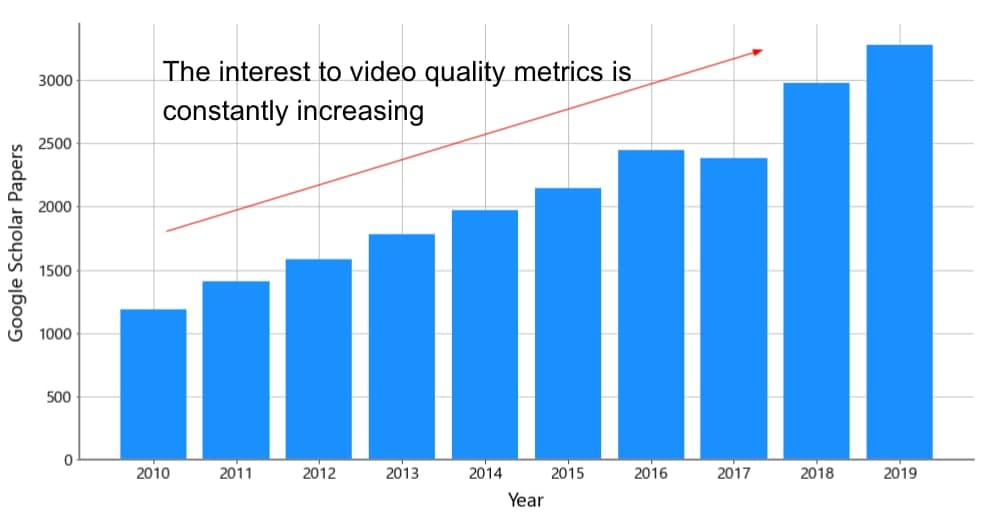
Fig. 24. Our result of analyzing interest in video quality metrics
However, industry and researchers still commonly use classical methods, although there is a lot of criticism. This doesn't mean that some methods are bad and some are good, you just need to clearly define the boundaries of applicability of any metric. According to our research, we can draw the following conclusion:
PSNR is good for:
- testing different codec optimisation strategies designed to maximise the subjective quality of a specified content (i.e. the content remains the same between the optimisations)
- capturing noise
- capturing changes in brightness, contrast, hue and saturation
but can not be applicated to:
- estimating content-dependent distortions
- capturing blurring
- testing different codec quality when content doesn't remain the same between tests
- quality assessment of Super-Resolution algorithms
- capturing rotations and spatial shifts
SSIM is good for:
- estimating content-dependent distortions
- capturing noise
- capturing blurring
but can not be applicated to:
- quality assessment of Super-Resolution algorithms
- capturing rotations and spatial shifts
- capturing changes in brightness, contrast, hue and saturation
New quality metrics are being actively developed now. Recent works in neural network metrics — LPIPS and DISTS — show high correlations with subjective assessment [7].
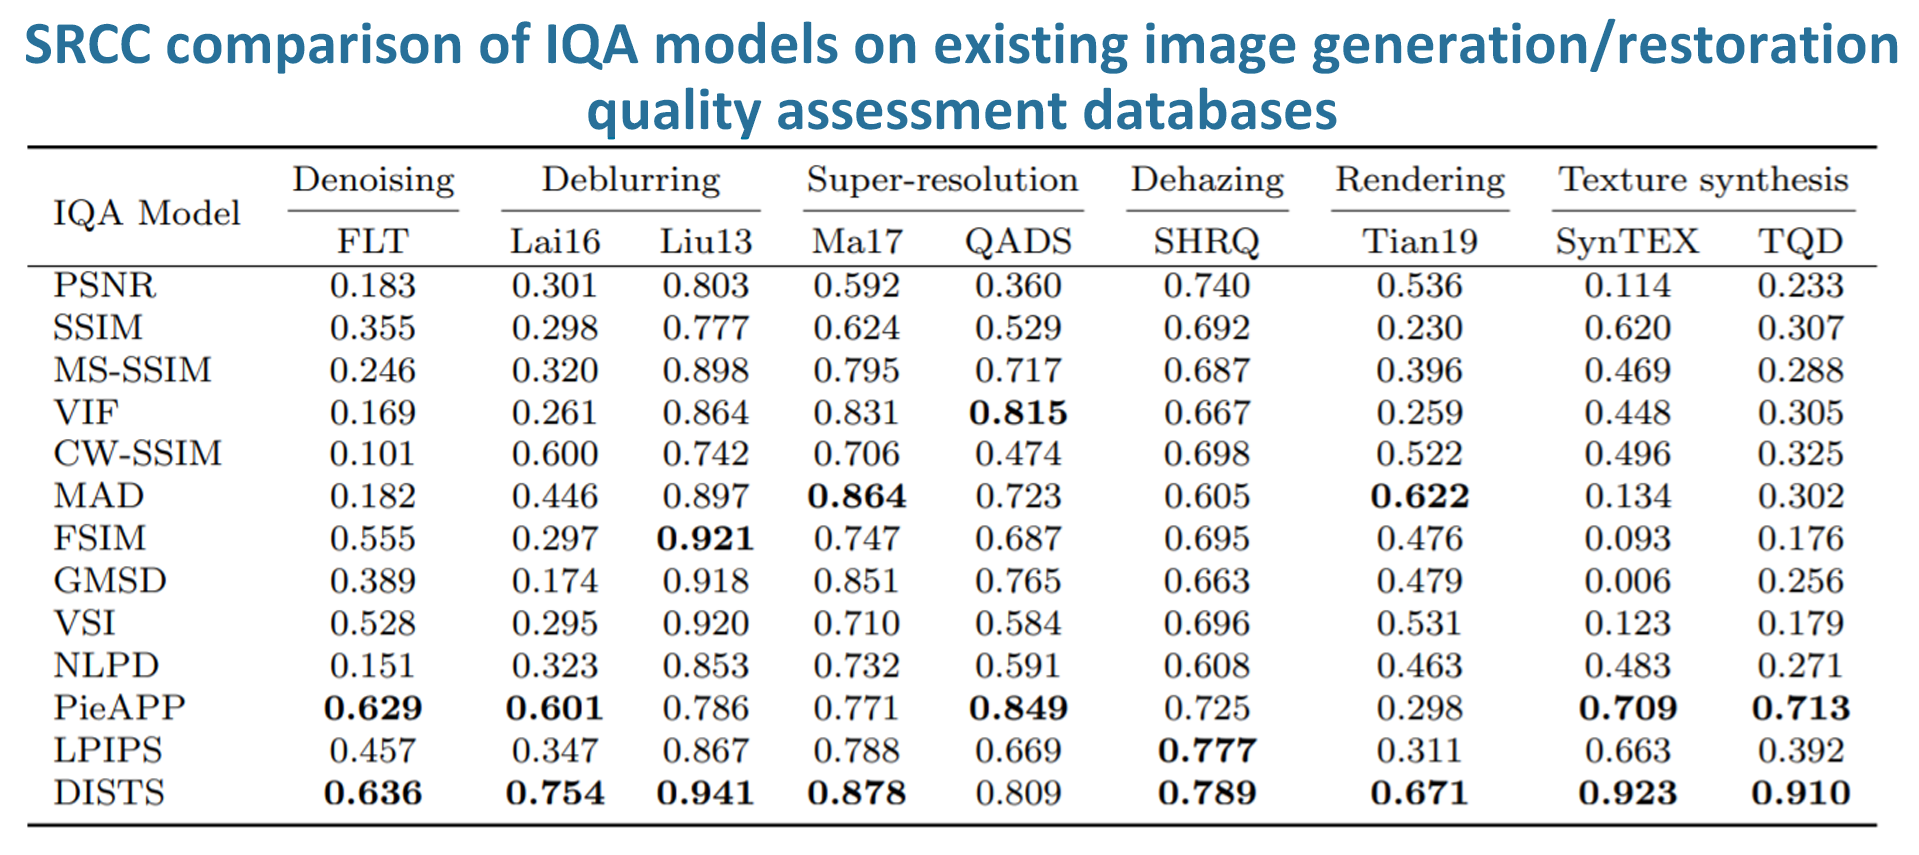
Fig. 25. SRCC of objective ranking scores from the IQA models against subjective ranking scores
Also, special metrics for specific recovery tasks (e.g. SR or deblurring) appear and show better results [12]. You can already find a metric for many tasks that is more suitable than PSNR and SSIM.
References
[1] Zhou Wang, A. C. Bovik, H. R. Sheikh and E. P. Simoncelli, "Image quality assessment: from error visibility to structural similarity," in IEEE Transactions on Image Processing, vol. 13, no. 4, pp. 600-612, April 2004, doi: 10.1109/TIP.2003.819861
https://ieeexplore.ieee.org/document/1284395
[2] Z. Wang and A. C. Bovik, "Mean squared error: Love it or leave it? A new look at Signal Fidelity Measures," in IEEE Signal Processing Magazine, vol. 26, no. 1, pp. 98-117, January 2009, doi: 10.1109/MSP.2008.930649.
https://ieeexplore.ieee.org/document/4775883
[3] Zoran Kotevski and Pece Mitrevski, "Experimental Comparison of PSNR and SSIM Metrics for Video Quality Estimation," in book: ICT Innovations 2009 (pp.357-366), January 2010, doi:10.1007/978-3-642-10781-8_37
[4] Mahmood Sharif, Lujo Bauer and Michael K. Reiter, "On the Suitability of Lp-norms for Creating and Preventing Adversarial Examples", July 2018
https://arxiv.org/pdf/1802.09653.pdf
[5] Peter Ndajah, Hisakazu Kikuchi, Masahiro Yukawa, Hidenori Watanabe and Shogo Muramatsu,"SSIM Image Quality Metric for Denoised Images" in conference: "Proceedings of the 3rd WSEAS international conference on Visualization, imaging and simulation", September 3, 2010
https://www.researchgate.net/publication/262157566_SSIM_image_quality_metric_for_denoised_images
[6] Aditya Anchuri, "Image Blur Metrics", Stanford University, 2011
https://media.gradebuddy.com/documents/2105719/478f7e3c-c9d4-4fd5-86cf-1d4b862ca0f9.pdf
[7] Keyan Ding, Kede Ma, Shiqi Wang and Eero P. Simoncelli, "Comparison of Image Quality Models for Optimization of Image Processing Systems", May 5, 2020
https://arxiv.org/pdf/2005.01338v2.pdf
[8] Q. Huynh-Thu andMohammed Ghanbari, "Scope of validity of PSNR in image/video quality assessment", February 2008, doi: 10.1049/el:20080522
[9] Z. Wang and E.P. Simoncelli, "Translation insensitive image similarity in complex wavelet domain," in Proc. IEEE Int. Conf. Acoustics, Speech, Signal Processing, Mar. 2005, pp. 573–576, doi: 10.1109/ICASSP.2005.1415469
https://ieeexplore.ieee.org/document/1415469
[10] Amy R. Reibman and Thilo Schaper, "Subjective performance evaluation of super-resolution image enhancement", January 2006
http://citeseerx.ist.psu.edu/viewdoc/download?doi=10.1.1.124.4971&rep=rep1&type=pdf
[11] A. R. Reibman, R. M. Bell and S. Gray, "Quality assessment for super-resolution image enhancement," in 2006 International Conference on Image Processing, 2006, pp. 2017-2020, doi: 10.1109/ICIP.2006.312895.
https://ieeexplore.ieee.org/document/4106955
[12] https://videoprocessing.ai/benchmarks/video-super-resolution.html
-
MSU Benchmark Collection
- Super-Resolution Quality Metrics Benchmark
- Video Colorization Benchmark
- Video Saliency Prediction Benchmark
- LEHA-CVQAD Video Quality Metrics Benchmark
- Learning-Based Image Compression Benchmark
- Super-Resolution for Video Compression Benchmark
- Defenses for Image Quality Metrics Benchmark
- Deinterlacer Benchmark
- Metrics Robustness Benchmark
- Video Upscalers Benchmark
- Video Deblurring Benchmark
- Video Frame Interpolation Benchmark
- HDR Video Reconstruction Benchmark
- No-Reference Video Quality Metrics Benchmark
- Full-Reference Video Quality Metrics Benchmark
- Video Alignment and Retrieval Benchmark
- Mobile Video Codecs Benchmark
- Video Super-Resolution Benchmark
- Shot Boundary Detection Benchmark
- The VideoMatting Project
- Video Completion
- Codecs Comparisons & Optimization
- VQMT
- MSU Datasets Collection
- Metrics Research
- Video Quality Measurement Tool 3D
- Video Filters
- Other Projects