The Methodology of the Learning-Based Image Compression Benchmark
Comparison methodology
Metrics and implementations
JPEG AI Quality Assessment Framework
MSU Video Quality Measurement Tool 14.1
Others
BSQ-rate
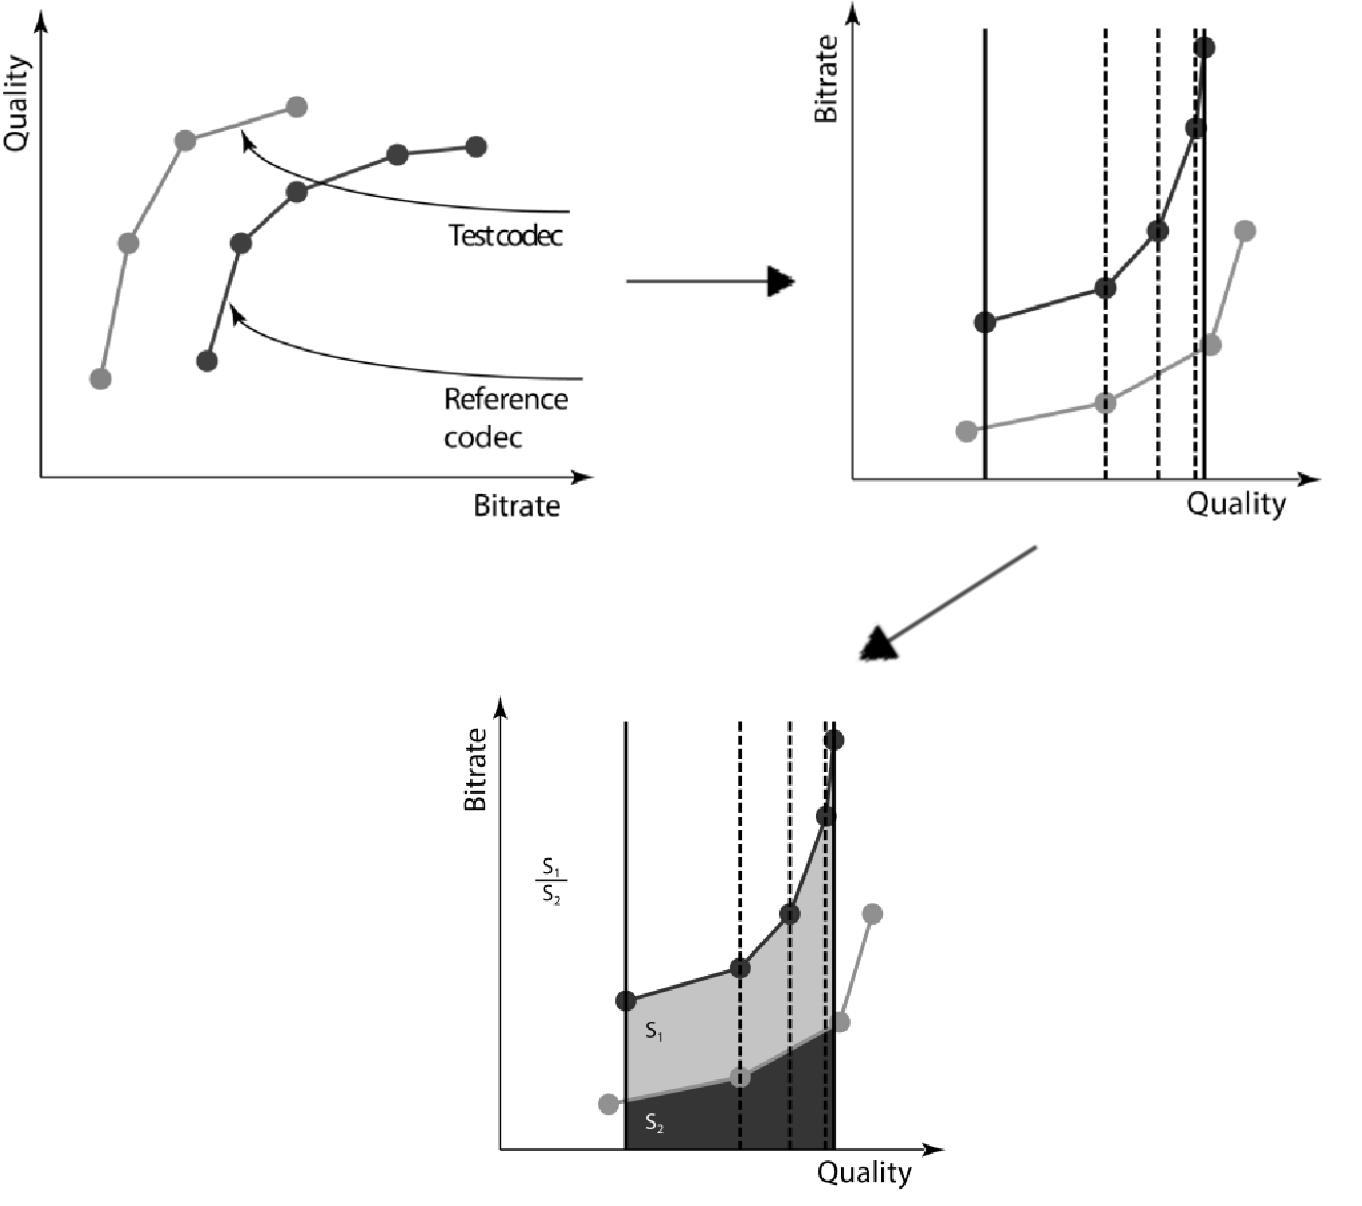
As a measure of Bitrate/Quality trade-off we use BSQ-rate[10] (Bitrate-for-the-Same-Quality rate). BSQ-rate can be calculated in 4 steps:
- Calculate rate/distortion values (points on the rate-distortion plot) for the reference and test codecs.
- If there are outlying points which lead to non-monotonic rate-distortion curve, remove them.

- Invert bitrate and quality axes, apply linear interpolation to the obtained points.
- Set the interval for integrating as the limits of obtained curves overlapping segments and calculate the areas under the curves in the chosen integration segment and determine their ratio: BSQ-rate = S1/S2.
Execution Time Measure
We measure execution time of each triplet (codec, image, bitrate) 3 times and choose minimal of them.
Dataset Preparation
Optimal Sequence Number
To define optimal sequence number, we conducted this research:
- Select a sample of 700 images
- Compress images with all codecs, calculate metrics and BSQ-rate
- Perform dataset subsampling with replacement
- Calculate the average deviation of BSQ-rate across all methods for each metric
- If the subsample size is 250 images and the average deviation of BSQ-rate is < 1%, in this case, the results on the subsample can be considered equivalent to the results on the full sample
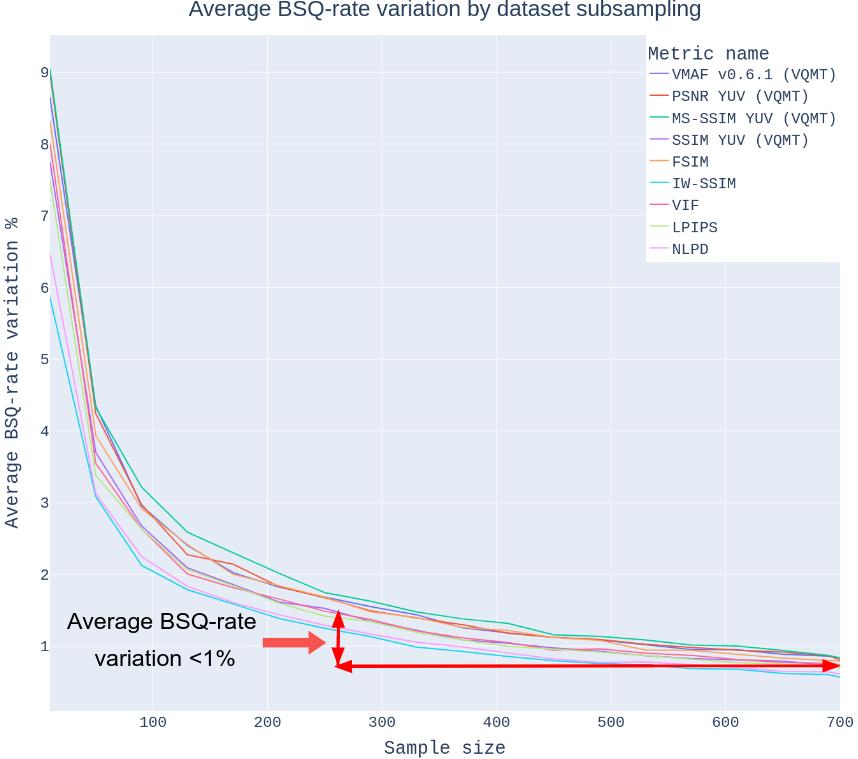
Image Resolutions
Our study examines codecs across three distinct resolution types, providing a comprehensive analysis of their effectiveness.
- HD
- Full HD
- 4K
Image Sources
We use images from 2 sources:
- Flickr - for image of Full HD and 4K resolutions
- OpenImages Dataset - for images of HD resolutions
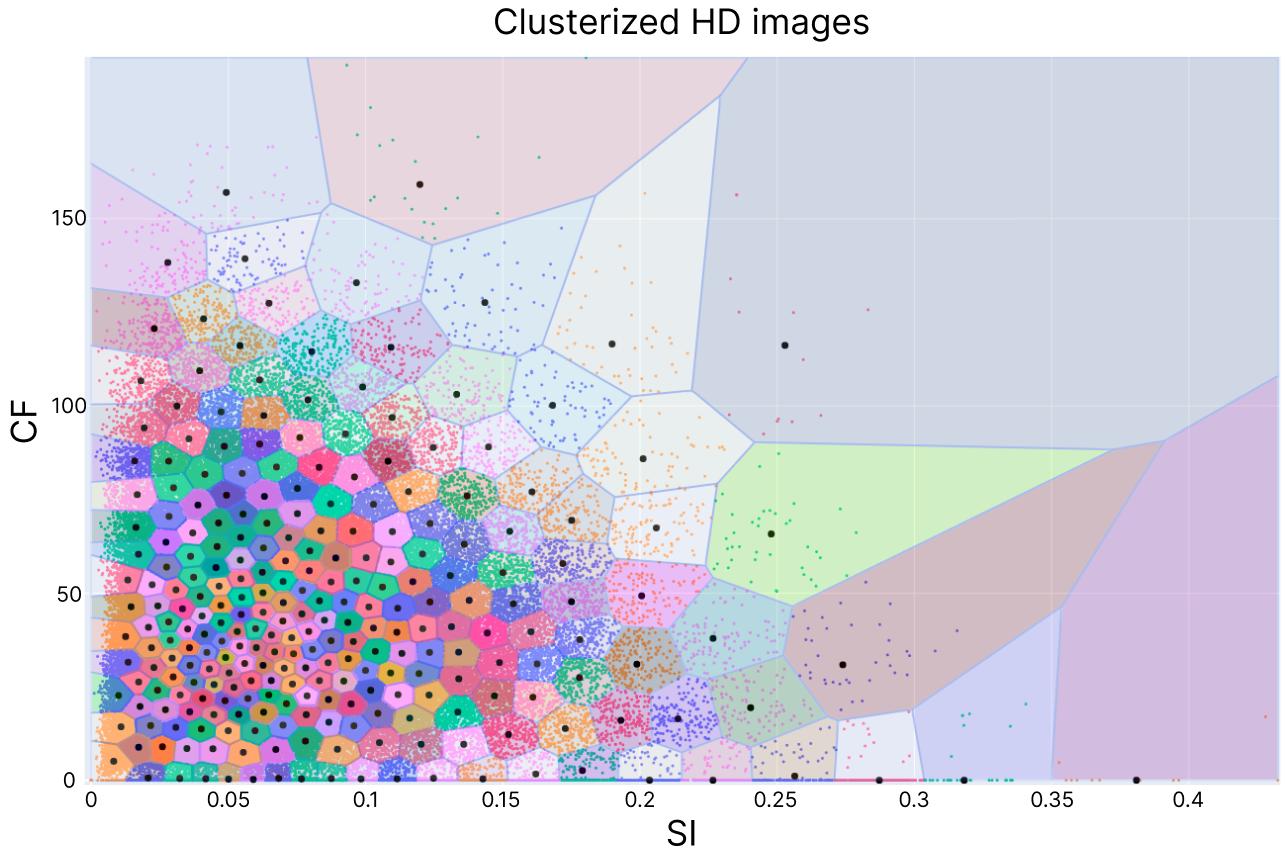
Image Selection
We processed over 1M images and selected 250 images per resolution. Selection was conducted based on two features:
-
\[SI(X) = std(Sobel(\|(Sobel_v, Sobel_h)\|_2)),\]
where \(Sobel_h\) and \(Sobel_v\) are horizontal and vertical Sobel transformation.
\[CF(X) = \sqrt{\sigma_{rq}^2 + \sigma_{yb}^2} + 0.3 * \sqrt{\mu_{rq}^2 + \mu_{yb}^2},\]
Where σ and μ are the standard deviation and the mean value of the pixel cloud along direction described by subscripts and
rg = R - G,
yb = 0.5 * (R + G) - B
- Images in each resolution were divided into 250 clusters
- Image closest to the cluster center selected as candidate
- Each candidate manually verified
Examples

Hardware
Calculations were made using the following hardware:
- GeForce RTX 3090 GPU, an Intel(R) Xeon(R) Gold 6226R CPU @ 2.90GHz
- NVIDIA RTX A6000 GPU, AMD EPYC 7532 32-Core Processor @ 2.40GHz
References
- Wang, Z. & Simoncelli, Eero & Bovik, Alan. (2003). Multiscale structural similarity for image quality assessment. Conference Record of the Asilomar Conference on Signals, Systems and Computers. 2. 1398 - 1402 Vol.2. 10.1109/ACSSC.2003.1292216.
- L. Zhang, L. Zhang, X. Mou and D. Zhang. FSIM: A Feature Similarity Index for Image Quality Assessment. IEEE Transactions on Image Processing, vol. 20, no. 8, pp. 2378-2386, Aug. 2011
- Zhou Wang and Qiang Li, Information Content Weighting for Perceptual Image Quality Assessment. IEEE Transactions on Image Processing, vol. 20, no. 5, pp. 1185-1198, May 2011.
- N. Ponomarenko, F. Silvestri, K.Egiazarian, M. Carli, V. Lukin, On Between-Coefficient Contrast Masking of DCT Basis Functions, CD-ROM proceedings of Third International Workshop on Video Processing and Quality Metrics for Consumer Electronics VPQM-07, January, 2007, 4p
- Valero Laparra, Alexander Berardino, Johannes Ballé, and Eero P. Simoncelli, "Perceptually optimized image rendering," J. Opt. Soc. Am. A 34, 1511-1525 (2017)
- Sheikh H. R. and Bovik A. C., Image Information and Visual Quality, IEEE Transactions on Image Processing, vol. 15, February, 2006, pp. 430-444
- VMAF repository
- Wang Z., Bovik A., Sheikh H., Simoncelli E., Image quality assessment: from error visibility to structural similarity, IEEE Transactions on Image Processing, vol.13, 2004, pp.600-612
- Richard Zhang, Phillip Isola, Alexei A. Efros, Eli Shechtman, Oliver Wang. The Unreasonable Effectiveness of Deep Features as a Perceptual Metric. Proceedings of the IEEE Conference on Computer Vision and Pattern Recognition (CVPR), 2018, pp. 586-595
- Antsiferova, Anastasia & Kulikov, Dmitriy & Zvezdakov, Sergey & Vatolin, Dmitriy. (2020). BSQ-rate: a new approach for video-codec performance comparison and drawbacks of current solutions. Proceedings of the Institute for System Programming of the RAS. 32. 89-108. 10.15514/ISPRAS-2020-32(1)-5.
-
MSU Benchmark Collection
- Super-Resolution Quality Metrics Benchmark
- Video Colorization Benchmark
- Video Saliency Prediction Benchmark
- LEHA-CVQAD Video Quality Metrics Benchmark
- Learning-Based Image Compression Benchmark
- Super-Resolution for Video Compression Benchmark
- Defenses for Image Quality Metrics Benchmark
- Deinterlacer Benchmark
- Metrics Robustness Benchmark
- Video Upscalers Benchmark
- Video Deblurring Benchmark
- Video Frame Interpolation Benchmark
- HDR Video Reconstruction Benchmark
- No-Reference Video Quality Metrics Benchmark
- Full-Reference Video Quality Metrics Benchmark
- Video Alignment and Retrieval Benchmark
- Mobile Video Codecs Benchmark
- Video Super-Resolution Benchmark
- Shot Boundary Detection Benchmark
- The VideoMatting Project
- Video Completion
- Codecs Comparisons & Optimization
- VQMT
- MSU Datasets Collection
- Metrics Research
- Video Quality Measurement Tool 3D
- Video Filters
- Other Projects