The Methodology of the Video Colorization Benchmark
Problem definition
The task of video colorization is to predict the colors of the input black and white video. Three groups of algorithms can be distinguished: fully automatic colorization, frame-based color propagation, and scribble-based color propagation.
We are mainly focused on color propagation algorithms, so we provide anchor frames for all architectures where it was possible. To check how many anchor frames were used for every algorithm check Participants section.
Datasets
Video sources
The videos in our dataset were collected from two sources:
- Some of the videos were taken from the platform Vimeo, all have a CC0 license
- Some of the videos were shot specifically for the dataset using an iPhone 13 camera
The video clips were cut manually so that the color propagation methods had a chance to work in the domain they were designed for. We minimized the appearance of new objects in the frames, information about which was missing in the first anchor frame.
Our dataset consists of videos in 720p and 1080p resolution with the number of frames ranging from 20 to 200.
For the final dataset, we calculated the values of the SI (spatial information) and TI (temporal information) metrics and compared with the DAVIS test which is often used in video colorization articles for comparison.
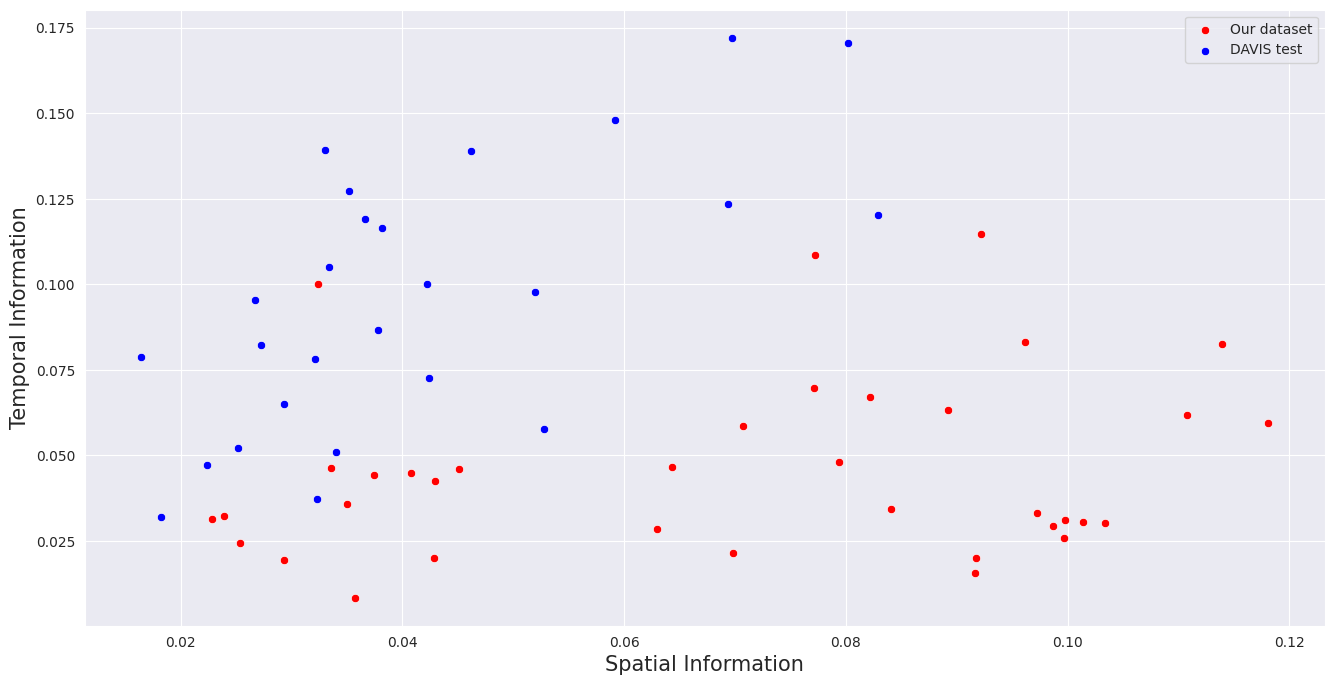
From the graph we can conclude that we have more complete coverage of videos in terms of SI, when DAVIS is not sufficiently complete. Since DAVIS was not created specifically to evaluate video colorization, TI values are too high for the task. You can see it in our visualisations, that it becomes difficult for the methods to work with the values we have chosen. For comparison, we used the VQMT[1] implementation of SI/TI metrics.
Full resolution and crops
We performed evaluation, including subjective, on both the original videos in source resolution and on crops. The goal was to compare how different resolutions will affect the perception of colorized videos and whether the methods' perfomance can be evaluated in the areas with the largest artifacts. To select the crops, we averaged the error map of the methods and croped around the highest values. From 36 selected source videos a total of 42 crops were obtained. We calculated PLCC between full resolution and crops overall subjective ranks and it equals to 0.99. This shows that our method of selecting crops is sufficient for assessing algorithms.
Subjective Comparison
Crowd-sourced subjective comparison with over 4000 valid participants was conducted using Subjectify.us[2]. Frames from the clips showed to the participants are available in the Visualizations section. Participants were asked to choose the most visually appealing clip in a pair, paying attention to color saturation, unrealistic color bleeding, color washout, and flickering colors.
We used the Bradley–Terry model for calculating subjective quality ranks. The crops comparison was conducted in side-by-side mode, while the full resolution comparison was conducted in sequential mode. Despite the different video display methodologies, the collected subjective scores showed a high correlation when comparing them to each other, with almost no change in the final ranking of the methods.
Metrics and runtime
Metrics
The following metrics were used for evaluation: PSNR, SSIM, LPIPS, ID, Colorfulness, CDC, WarpError. Check Metrics section for their more detailed description.
We also introduce a new metric, the Video Colorization Quality Index (VCQI), which achieves the highest correlation with our human judgements. For a full description and results see the dedicated VCQI entry in the Metrics section.
Runtime
We measured the runtime for each method on a 720p video. The average time per frame on video was calculated and three runs were performed, from which the minimum was taken. When measuring the speed, only the inference time was taken into account, the time of reading and writing frames was not counted. The measurements were performed on an NVIDIA GeForce RTX 3090 graphics card.
References
-
MSU Benchmark Collection
- Super-Resolution Quality Metrics Benchmark
- Video Colorization Benchmark
- Video Saliency Prediction Benchmark
- LEHA-CVQAD Video Quality Metrics Benchmark
- Learning-Based Image Compression Benchmark
- Super-Resolution for Video Compression Benchmark
- Defenses for Image Quality Metrics Benchmark
- Deinterlacer Benchmark
- Metrics Robustness Benchmark
- Video Upscalers Benchmark
- Video Deblurring Benchmark
- Video Frame Interpolation Benchmark
- HDR Video Reconstruction Benchmark
- No-Reference Video Quality Metrics Benchmark
- Full-Reference Video Quality Metrics Benchmark
- Video Alignment and Retrieval Benchmark
- Mobile Video Codecs Benchmark
- Video Super-Resolution Benchmark
- Shot Boundary Detection Benchmark
- The VideoMatting Project
- Video Completion
- Codecs Comparisons & Optimization
- VQMT
- MSU Datasets Collection
- Metrics Research
- Video Quality Measurement Tool 3D
- Video Filters
- Other Projects