Evaluation methodology of MSU Super-Resolution for Video Compression Benchmark
Benchmark Statistics
|
Date |
Participants |
Sequences |
Codecs |
Valid answers in subjective comparison |
|
21.08.2024 |
19 |
9 |
5 |
120 316 |
|
12.04.2022 |
18 |
9 |
5 |
120 316 |
|
25.03.2022 |
18 |
9 |
5 |
57 943 |
|
14.03.2022 |
15 |
9 |
5 |
57 943 |
|
12.10.2021 |
13 |
7 |
5 |
57 943 |
|
21.09.2021 |
13 |
5 |
5 |
57 943 |
|
31.08.2021 |
13 |
3 |
5 |
57 943 |
Table 1: Benchmark statistics
Problem definition
Super-Resolution is the process of calculating high-resolution samples from their low-resolution counterparts. Due to the rapid development of Video Super-Resolution technologies, they are used in video codecs.
Different SR models have different bitrate/quality tradeoffs when working with compressed video sequences. If two SRs produce results of the same subjective quality, the one that works with the lower bitrate input is considered to be better. Our benchmark aims to find the best Video Super-Resolution algorithm based on this criterion.
We are currently testing only 4× upscale.
Dataset
Our dataset is constantly being updated. You can see the current number of sequences in the dataset in Table 1. Each FullHD video in yuv format is decoded with 6 different bitrates using 5 different codecs. Videos were recorded specifically for the benchmark or taken from MSU codecs comparison[1] 2019 and 2020 test sets. The dataset contains videos in FullHD resolution with FPS from 24 to 30.
All videos have low SI/TI value and simple textures. It was made to minimize compression artifacts that may occur to make restoration of details possible.
Note that 3 out of 9 these videos are private, which means that the results for these videos are available only in the upcoming enterprise report.
Figure 1. Segments from dataset
Metrics
PSNR
PSNR is a commonly used metric for reconstruction quality for images and video. In our benchmark, we calculate PSNR on the Y component in YUV colorspace.
Since some Super-Resolution models can generate images with a global shift relative to GT, we calculate shifted PSNR. We check each shift in the range [-3, 3] (including subpixel shifts) for both axes and select the highest PSNR value among these shifts. We noticed that SRs’ results on the same video decoded with different bitrates usually have the same global shift. Thus we calculate the best shift only once for each video.
For metric calculation, we use MSU VQMT[2].
MS-SSIM
SSIM is a metric based on structural similarity. In our benchmark, we use Multiscale SSIM (MS-SSIM), which is conducted over multiple scales through a process of multiple stages of sub-sampling. We calculate MS-SSIM on Y components in the YUV colorspace, since this method shows the best correlation with subjective scores[13].
These results also rely on the shift of frames. We take optimal subpixel shift for PSNR and apply in to input frames before calculating MS-SSIM.
For metric calculation, we use MSU VQMT[2].
VMAF
VMAF is a perceptual video quality assessment algorithm developed by Netflix. In our benchmark, we calculate VMAF on the Y component in YUV colorspace.
For metric calculation, we use MSU VQMT[2].
For VMAF we use -set "disable_clip=True" option of MSU VQMT.
LPIPS
LPIPS (Learned Perceptual Image Patch Similarity) evaluates the distance between image patches. Higher means further/more different. Lower means more similar. In our benchmark, we subtract LPIPS value from 1. Thus, more similar images have higher metric values.
To calculate LPIPS we use Perceptual Similarity Metric implementation[3] proposed in The Unreasonable Effectiveness of Deep Features as a Perceptual Metric[4].
ERQA
ERQAv2.0 (Edge Restoration Quality Assessment, version 2.0) estimates how well a model has restored edges of the high-resolution frame. This metric was developed for MSU Video Super-Resolution Benchmark 2021[5].
Firstly, we find edges in both output and GT frames. To do it we use OpenCV implementation[6] of the Canny algorithm[7]. A threshold for the initial finding of strong edges is set to 200 and a threshold for edge linking is set to 100. Then we compare these edges by using an F1-score. To compensate for the one-pixel shift, edges that are no more than one pixel away from the GT's are considered true-positive.
More information about this metric can be found at the Evaluation Methodology of MSU Video Super-Resolution Benchmark[9].

Figure 2. ERQAv2.0 visualization.
White pixels are True Positive, red pixels are False Positive, blue pixels are False Negative
Other metrics
We also calculate VMAF NEG (no enhancements gain), YUV-SSIM and YUV-PSNR. More information about these metrics can be found in our upcoming enterprise report.
Codecs
To compress GT videos, we use the following codecs:
|
Codec |
Standart |
Implementation |
|
x264 |
H.264 |
FFmpeg version 2021-04-28-git-1ab74bc193-full_build-www.gyan.dev |
|
x265 |
H.265 |
FFmpeg version 2021-04-28-git-1ab74bc193-full_build-www.gyan.dev |
|
aomenc |
AV1 |
FFmpeg version 2021-04-28-git-1ab74bc193-full_build-www.gyan.dev |
|
VVenC |
H.266 |
Fraunhofer Versatile Video Encoder[11] |
|
uavs3e |
AVS3 |
uavs3e[12] |
Table 2: Codecs' description
For x264, x265, aomenc, and VVenC we use -preset=“medium” option.
To compress videos with uasv3e we use the following command:
uavs3e.exe -w {width} -h {height} -i {in_path} -o {out_path} -r  {result_path} --rc_type 1

              --rc_crf {crf} --fps_num {FPS} --fps_den 1 -d 8
Evaluation
Firstly, we downscale our FullHD GT video using FFmpeg to make it 480×270 resolution.
We use the flags::bicubic option to keep more information in the resulting video.
Then, we compress scaled video with seven different bitrates
(approximately 100, 300, 600, 1000, 2000, and 4000 kbps).
The resulting videos are transcoded to .png sequences and given as an input to a
Super-Resolution model.
In our benchmark we test 4× upscale, however, there are some Super-Resolution models which can only do 2× upscale. In this case, we apply them twice.
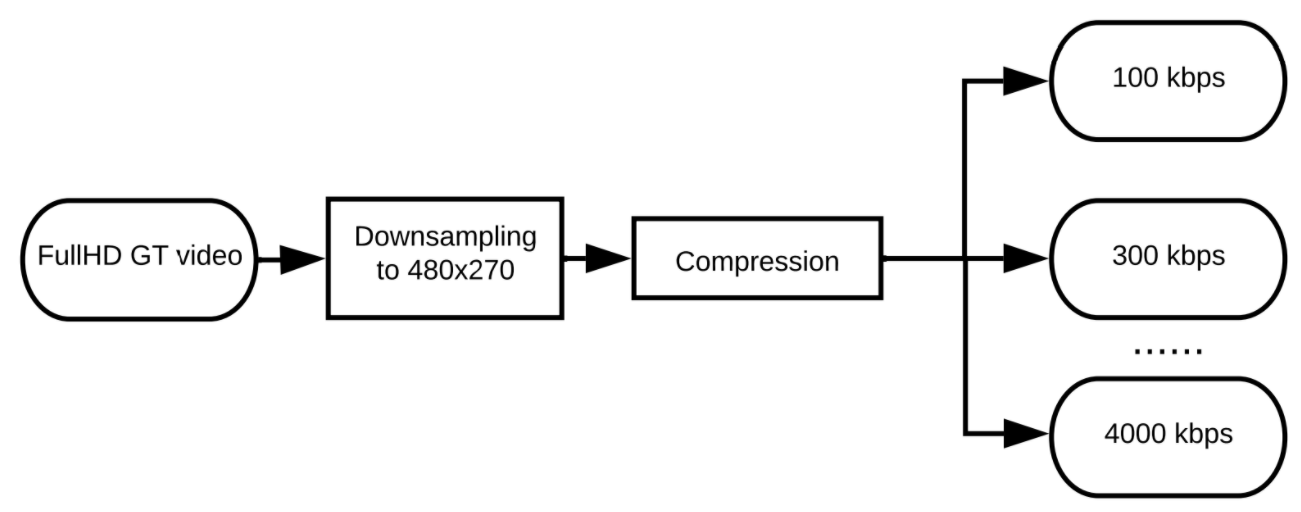
Figure 3. SR results evaluation steps
Next, we calculate each metric for each result (including the results of applying codecs without downscaling). We calculate shifted Y-PSNR, shifted Y-MS-SSIM, Y-VMAF, LPIPS, and ERQAv2.0. Then, we build RD curves (see Figure 4) and calculate BSQ-rate[8] (bitrate-for-the-same-quality rate) for each metric (see Figure 5). We take the results of applying codecs without downscaling as a reference during the calculations.
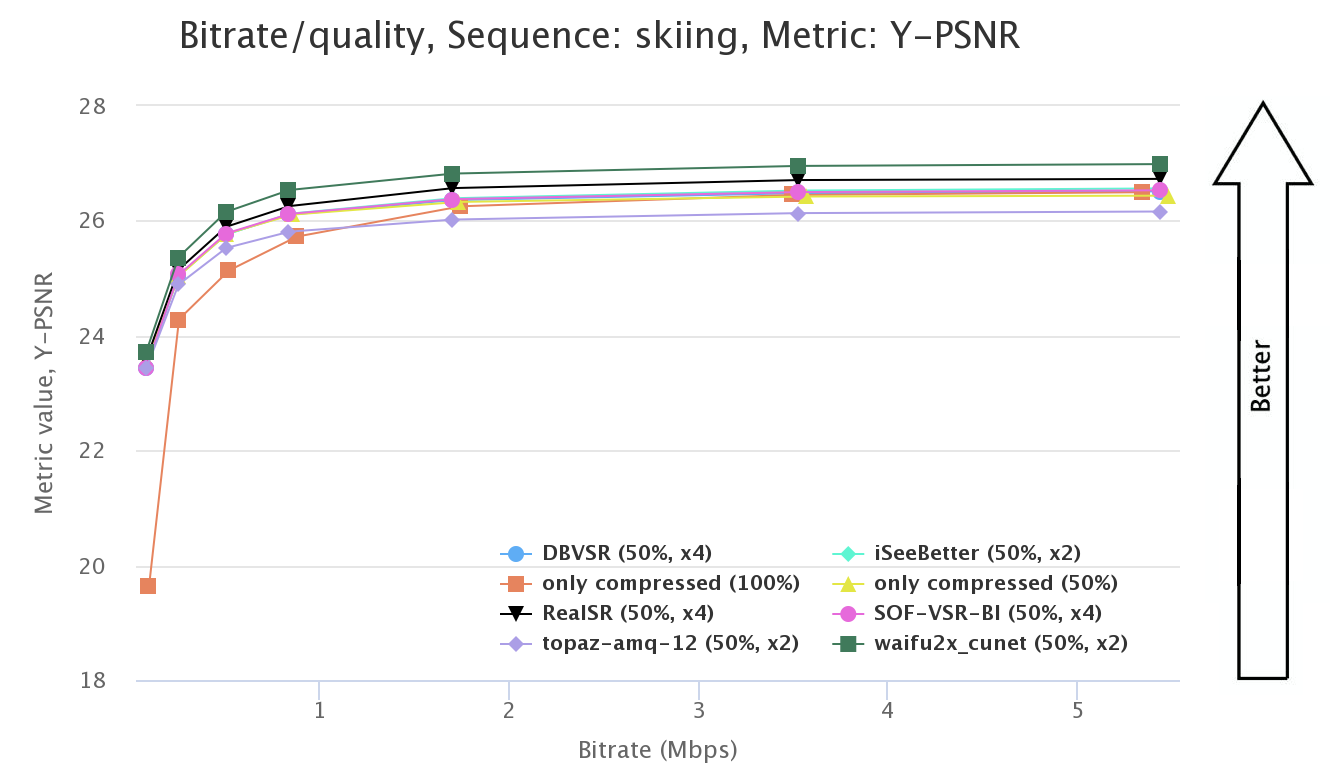
Figure 4. RD curve
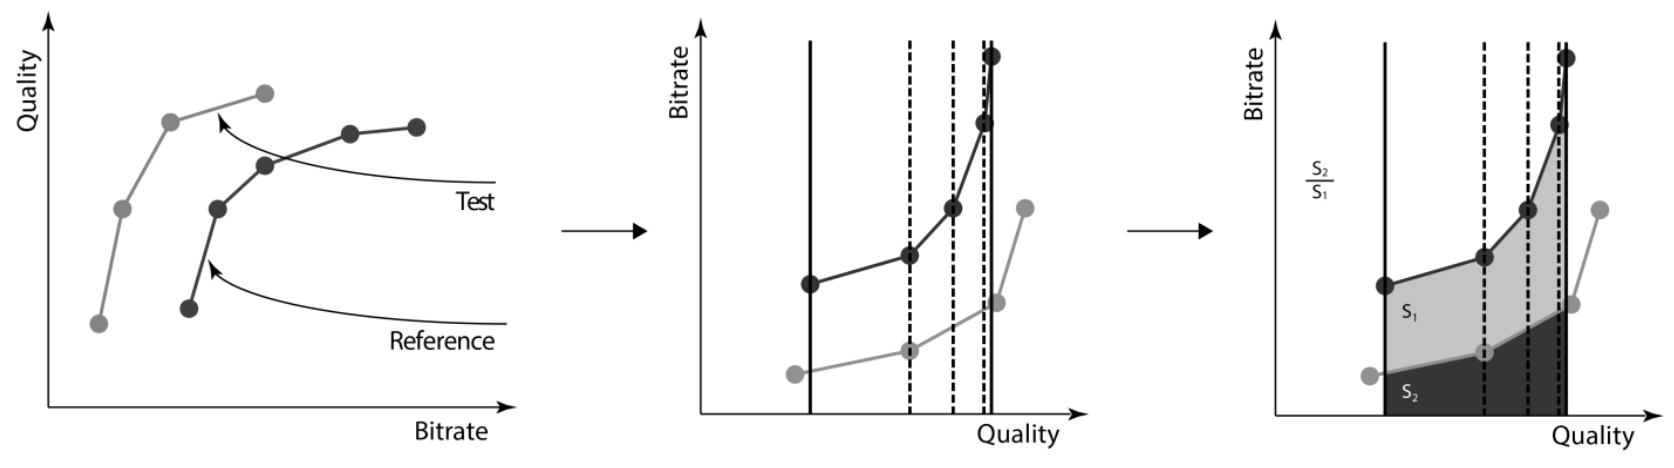
Figure 5. BSQ-rate
Subjective comparison
We have conducted 5 subjective comparisons for each codec separately. We took videos compressed with 3 different bitrates (approximately 600, 1000, and 2000 kbps) and cut one crop of size 480×270 from each video. The crops were chosen based on saliency maps generated by the method [14] proposed in Contextual encoder-decoder network for visual saliency prediction[15]. We selected 10 visually different SR models for each codec. Each one of 5397 participants has seen 25 video pairs and had to choose which one of them looks more realistic (option “indistinguishable” is also available). There were 3 verification questions to protect against random answers and bots. You can see the current number of valid answers in Table 1. We used these valid answers to predict the ranking using the Bradley-Terry model.
Figure 6. Crops used for subjective comparison.
Computational complexity
We run each model on NVIDIA Titan RTX and calculated runtime on the same test sequence:
- 100 frames
- Input resolution — 480×270
-
Test case:
- video — dancing
- codec — x264
- bitrate — 836 kbps
We calculate frames per second (FPS) as the number of sequence frames divided by the execution time of a total model runtime.
References
- https://compression.ru/video/codec_comparison/2021/
- http://compression.ru/video/quality_measure/video_measurement_tool.html
- https://github.com/richzhang/PerceptualSimilarity
- R. Zhang, P. Isola, A. A. Efros, E. Shechtman, O. Wang, "The unreasonable effectiveness of deep features as a perceptual metric," in Proceedings of the IEEE conference on computer vision and pattern recognition, 2020, pp.586-595.
- https://videoprocessing.ai/benchmarks/video-super-resolution.html
- https://docs.opencv.org/3.4/dd/d1a/group__imgproc__feature.html#ga04723e007ed888ddf11d9ba04e2232de
- https://en.wikipedia.org/wiki/Canny_edge_detector
- A. V. Zvezdakova, D. L. Kulikov, S. V. Zvezdakov, D. S. Vatolin, "BSQ-rate: a new approach for video-codec performance comparison and drawbacks of current solutions," in Programming and computer software, vol. 46, 2020, pp.183-194.
- https://videoprocessing.ai/benchmarks/video-super-resolution-methodology.html
- http://app.subjectify.us/
- https://github.com/fraunhoferhhi/vvenc
- https://github.com/uavs3/uavs3e
- A. Antsiferova, A. Yakovenko, N. Safonov, D. Kulikov, A. Gushin, D.Vatolin, "Objective video quality metrics application to video codecs comparisons: choosing the best for subjective quality estimation," in arXiv preprint arXiv:2107.10220, 2021
- https://github.com/alexanderkroner/saliency
- A. Kroner, M. Senden, K. Driessens, and R. Goebel, "Contextual encoder-decoder network for visual saliency prediction," in Neural Networks, 129, pp. 261-270, 2020.
-
MSU Benchmark Collection
- Super-Resolution Quality Metrics Benchmark
- Video Colorization Benchmark
- Video Saliency Prediction Benchmark
- LEHA-CVQAD Video Quality Metrics Benchmark
- Learning-Based Image Compression Benchmark
- Super-Resolution for Video Compression Benchmark
- Defenses for Image Quality Metrics Benchmark
- Deinterlacer Benchmark
- Metrics Robustness Benchmark
- Video Upscalers Benchmark
- Video Deblurring Benchmark
- Video Frame Interpolation Benchmark
- HDR Video Reconstruction Benchmark
- No-Reference Video Quality Metrics Benchmark
- Full-Reference Video Quality Metrics Benchmark
- Video Alignment and Retrieval Benchmark
- Mobile Video Codecs Benchmark
- Video Super-Resolution Benchmark
- Shot Boundary Detection Benchmark
- The VideoMatting Project
- Video Completion
- Codecs Comparisons & Optimization
- VQMT
- MSU Datasets Collection
- Metrics Research
- Video Quality Measurement Tool 3D
- Video Filters
- Other Projects