Methodology of the MSU Video Quality Metrics Benchmark
Problem definition
Video Quality Metrics or Video Quality Assessment (VQA) benchmark provides performance of No-reference (pristine signal is not required) and Full-reference methods, which are capable of assessing the quality of different videos. Unlike images, videos contain temporal information, whose usage can lead to a more reliable prediction of quality. That’s why the proposed benchmark includes both VQA and IQA methods, which have been tested on a range of diverse sequences, compressed with different standards, presets, and bitrates.
To make the research more objective, experiments with methods performance evaluation on some pools of videos separately have been conducted. Finally, we have provided all the results and analysis not only through tables but also using visualizations to simplify the perception of the great amount of information.
The ranking of some existing methods proposed through this benchmark may help the reader either detect features in top methods to create their own SOTA VQA method or choose the best methods for their aims, such as finding the perceptual optimization of RD tradeoffs in video encoding and streaming.
Dataset description
You can explore our dataset here. You can download the dataset from HuggingFace: https://huggingface.co/datasets/deepfakesMSU/CVQAD
Dataset characteristics
The dataset was formed with 36 clips from Vimeo, which were selected from 18,000+ open-source clips with high bitrate (license CCBY or CC0). The clips include videos recorded by both professionals and amateurs. Almost half of the videos contain scene changes and high dynamism. Moreover, the synthetic to natural lightning ratio is approximately 1 to 3.
- Content type: nature, sport, humans close up, gameplays, music videos, water stream or steam, CGI
- Effects and distortions: shaking, slow-motion, grain/noisy, too dark/bright regions, macro shooting, captions (text), extraneous objects on the camera lens or just close to it
- Resolution: 1920x1080 as the most popular modern video resolution (more in the future)
- Format: yuv420p
- FPS: 24, 25, 30, 39, 50, 60
- Videos duration: mainly 10 seconds
Such content diversity helps simulate near-realistic conditions.
Video selection procedure
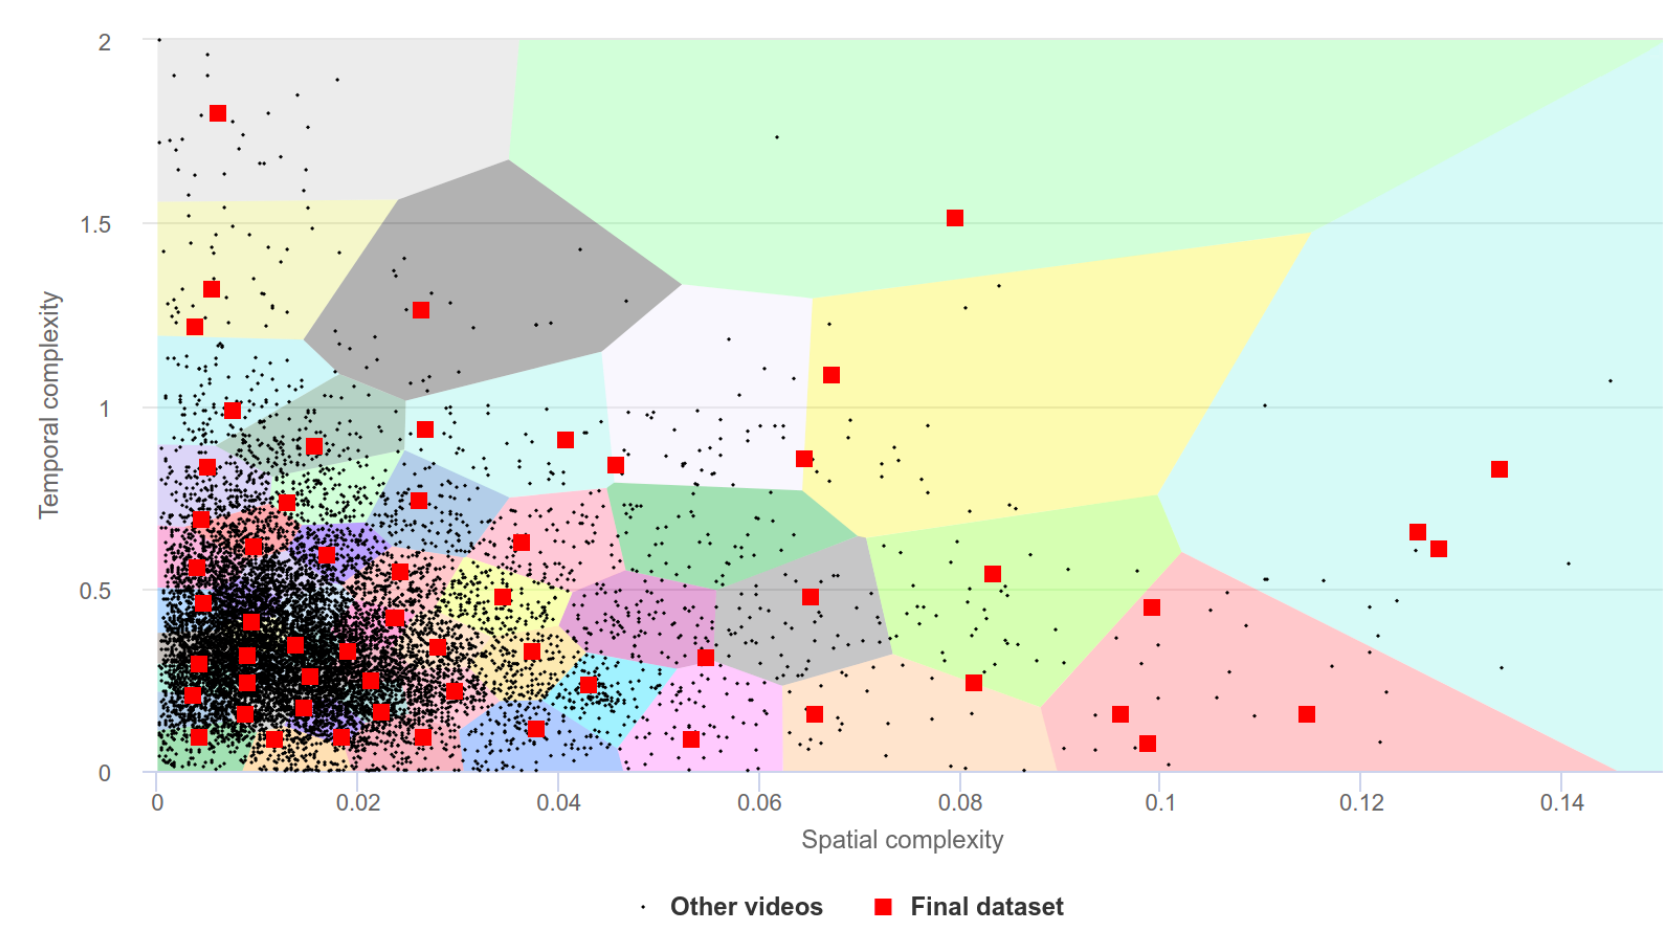
The choice of videos collected for the benchmark dataset employed clustering in terms of space-time complexity to obtain a representative distribution.
We encoded all samples using x264 with a constant quantization parameter and then calculated the temporal and spatial complexity for each scene. In our definition spatial complexity is the average size of the I-frame normalized to the sample’s uncompressed frame size, while temporal complexity is the average size of the P-frame divided by the average size of the I-frame.
Finally, an additional preprocessing step was added to unify chroma subsampling of videos, which affects evaluating complexity. All videos were converted to YUV 4:2:0 chroma subsample.
The chart below shows the distribution of SI/TI characteristics. The red dots represent video from our dataset. The remaining dots represent the remaining videos from the original pool of videos.
Compression
We obtained numerous coding artifacts by compressing videos through 60 several encoders (or 83 ecoders including different presets) of more than 5 compression standards (H.264/AVC, H.265/HEVC, H.266/VVC, AV1, VP9). To increase the diversity of coding artifacts, we also used two different presets for many encoders: one that provides a 30 FPS encoding speed and the other that provides a 1 FPS speed and higher quality.
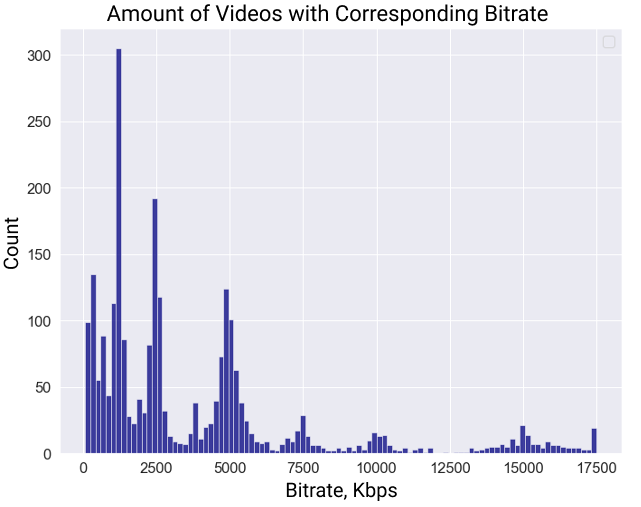
Each video was compressed with 3 target bitrates: 1,000 Kbps, 2,000 Kbps, and 4,000 Kbps, and different real-life encoding modes: constant quality (CRF) and variable bitrate (VBR). The choice of bitrate range simplifies the subjective comparison procedure since the video quality is more difficult to distinguish visually at higher bitrates.
Below the distribution of obtained videos bitrates of the dataset is provided. It differs from target values due to the usage of VBR encoding mode for some streams.
Subjective assessment
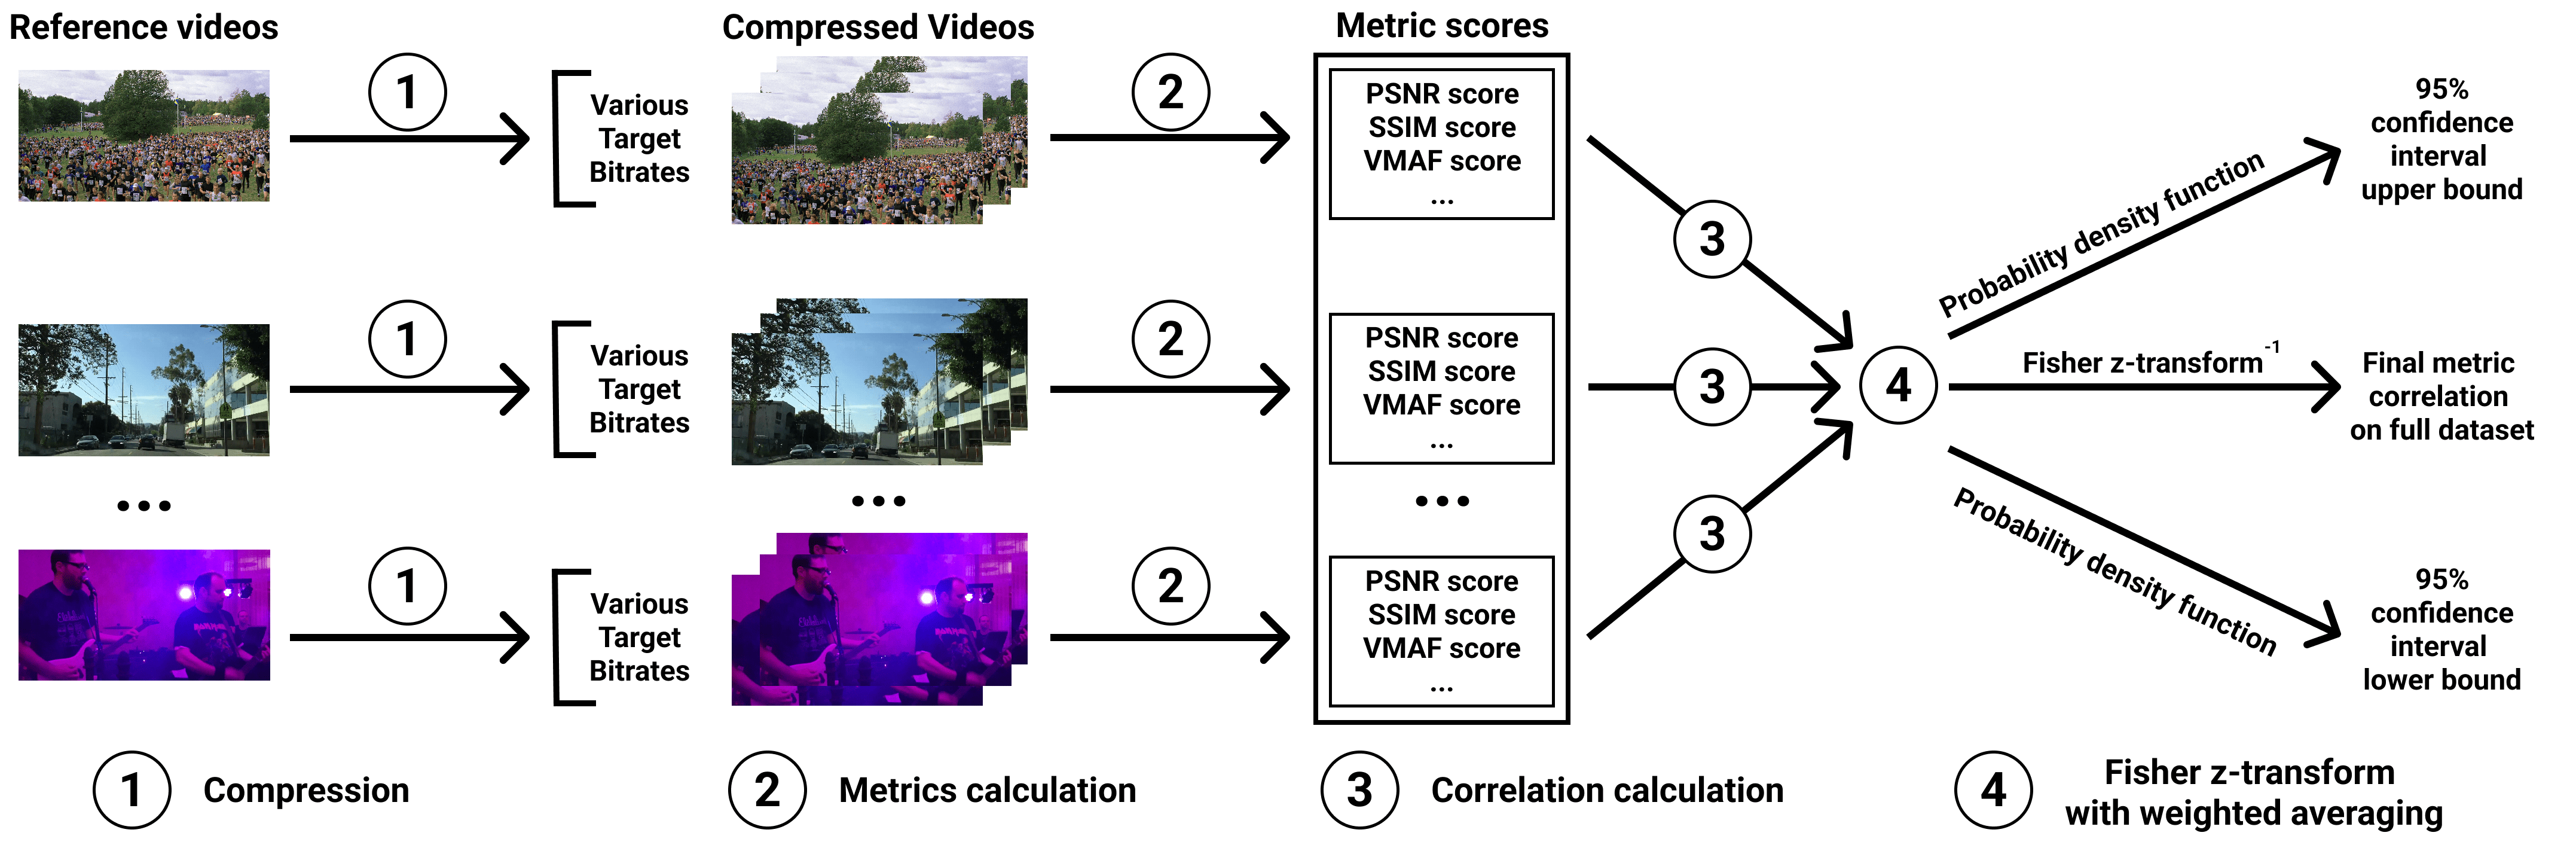
The subjective assessment involved pairwise comparisons using Subjectify.us. Each pair, which was offered to hired participants, consisted of two samples of the same test video sequence encoded by various codecs at various bitrates. After viewing each pair, participants were asked to choose the video with better visual quality. They also had the option to play the videos again or to indicate that the videos have equal visual quality.
To each study participant 10 pairs were assigned, including 2 hidden quality-control pairs, and then the collected pairwise results were converted to subjective scores using the Bradley-Terry model. Because Bradley-Terry scores were calculated only between encoded streams with the same reference video, correlations were calculated for each reference video (and corresponding encoded streams) separately. To calculate a single correlation for a whole dataset we use Fisher Z-transform to average group correlations weighted proportionally to group size. The quality-control pairs consisted of test videos compressed by the x264 encoder at 1 Mbps and 4 Mbps and were used to protect the comparison against random answers and bots: the responses of participants who failed it were excluded.
To increase the relevance of the results, each pair of videos received at least 10 responses from participants. In total, 766362 valid answers were collected from more than 10800 unique participants.
Benchmark methodology
Metrics calculation steps
Below the steps of metrics calculation are presented. To avoid overfitting on our dataset we have used already fitted models with publicly available source code without changing default parameters.
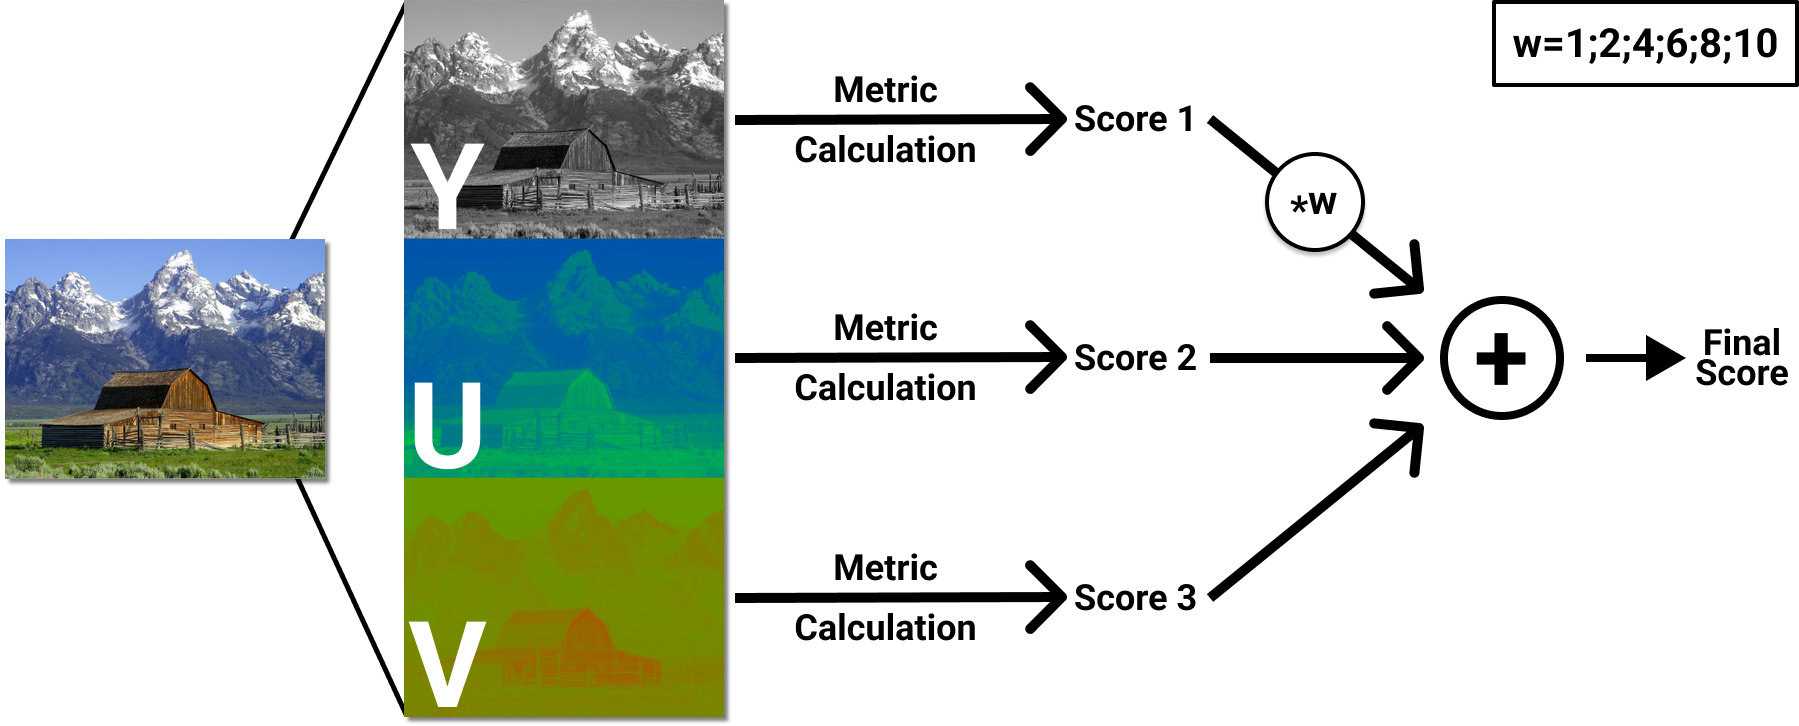
Some metrics (VMAF, PSNR, SSIM, MS-SSIM, VQM, NIQE) were tested on each YUV component as well as using component averaging with different weights. For example, you can find results for SSIM calculated solely on the Y component and with a 6:1:1 ratio weighted averaging.
The steps for calculating versions of such metrics are presented below.
IQA methods calculation
Due to the results of our small (in terms of the data size) research for IQA methods Mean Temporal Pooling was selected as a way of aggregatig of each frame scores.
Therefore, to get a quality score for a video using IQA methods, we compared the given distorted sequence frame by frame with the corresponding frames of the reference video and then averaged calculated scores. The research mentioned above will be reproduced with more data in the future.
- To encode the video we used the following command:
ffmpeg −f rawvideo −vcodec rawvideo −s {width}x{height} −r {FPS} −pix_fmt yuv420p −i {video name}.yuv −c:v libx265 −x265−params " lossless =1:qp=0" −t {hours : minutes : seconds} −vsync 0 {video name}.mp4
- To decode the video back to YUV you can use:
ffmpeg -i {video name}.mp4 -pix_fmt yuv420p -vcodec rawvideo -f rawvideo {video name}.yuv
- To convert the encoded video to the set of PNG images you can use:
ffmpeg -i {video name}.mp4 {frames dir}/frame_%05d.png
Correlation coefficients
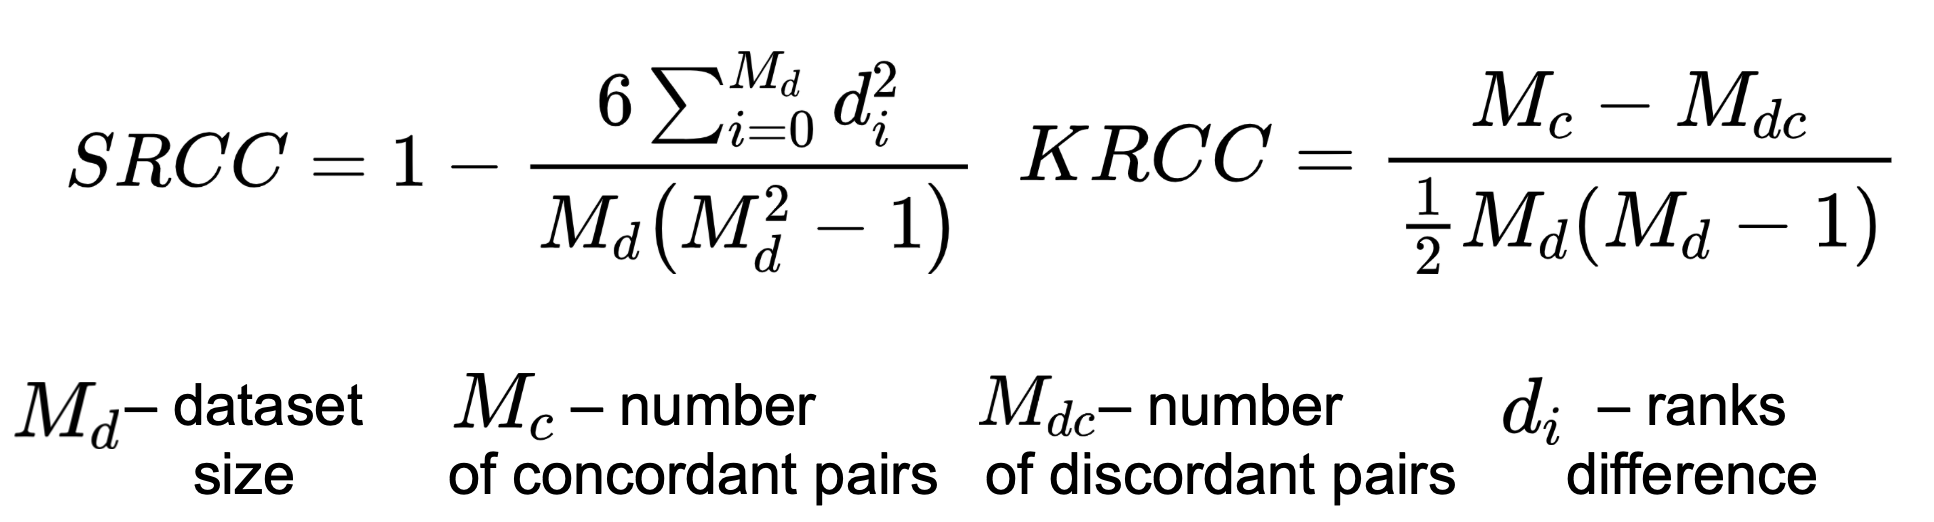
To calculate correlation measure subjective scores and metric’s output we chose Spearman’s Rank Correlation Coefficient (SRCC), Kendall’s Rank Correlation Coefficient (KRCC). Both measure the prediction monotonicity (the limit, to which the quality scores of a metric agree with the relative magnitude of the subjective scores).
Speed perfomance
We have also measured the metrics speed performance, expressed in FPS (the execution time of a full model runtime divided by the number of sequence frames).
- Used videos:
- 5 reference videos compressed with x264 codec (3 target bitrates)
- 3 metric calculation for each distorted video
- 15 compressed videos and 45 total amount of measurements
- Output: maximum FPS of metric on any video.
- Calculations were made using the following hardware:
- NVIDIA Titan RTX GPU
- 64 CPUs cluster, Intel(R) Xeon(R) Silver 4216 CPU @ 2.10GHz
-
MSU Benchmark Collection
- Super-Resolution Quality Metrics Benchmark
- Video Colorization Benchmark
- Video Saliency Prediction Benchmark
- LEHA-CVQAD Video Quality Metrics Benchmark
- Learning-Based Image Compression Benchmark
- Super-Resolution for Video Compression Benchmark
- Defenses for Image Quality Metrics Benchmark
- Deinterlacer Benchmark
- Metrics Robustness Benchmark
- Video Upscalers Benchmark
- Video Deblurring Benchmark
- Video Frame Interpolation Benchmark
- HDR Video Reconstruction Benchmark
- No-Reference Video Quality Metrics Benchmark
- Full-Reference Video Quality Metrics Benchmark
- Video Alignment and Retrieval Benchmark
- Mobile Video Codecs Benchmark
- Video Super-Resolution Benchmark
- Shot Boundary Detection Benchmark
- The VideoMatting Project
- Video Completion
- Codecs Comparisons & Optimization
- VQMT
- MSU Datasets Collection
- Metrics Research
- Video Quality Measurement Tool 3D
- Video Filters
- Other Projects