MSU CVQAD
Compressed Video Quality Assessment Dataset

Key features
- 32 different video codecs (including different encoding settings)
- 5 compression standards (H.264/AVC, H.265/HEVC, H.266/VVC, AV1, VP9)
- 1,022 compressed streams
- 320,000+ subjective scores
- 10,800+ viewers
- 2 sets of encoding settings (1 FPS and 30 FPS encoding)
- Includes user-generated content
Note
It is the open part of the MSU Video Quality Metrics Benchmark dataset. We employ the hidden part (60% of the entire dataset) only for testing through our benchmark to ensure a more objective comparison of future applications. This approach may prevent learning-based methods from training on the entire dataset, thereby avoiding overfitting and incorrect results. If you develop or know some no-reference or full-reference video quality assessment methods (or metrics), you can easily submit them to the benchmark to estimate their performance on the compression artifacts and compare it with the best open and commercial methods. Please follow the submission steps.
Downloads
You can download the dataset from HuggingFace: https://huggingface.co/datasets/deepfakesMSU/CVQAD
NeurIPS Paper (2022)
Dataset
Methodology
Video Compression
To analyze the relevance of quality metrics to video compression, we collected a special dataset of videos exhibiting various compression artifacts. For video-compression-quality measurement, the original videos should have a high bitrate or, ideally, be uncompressed to avoid recompression artifacts. We chose from a pool of more than 18,000 high-bitrate open-source videos from www.vimeo.com. Our search included a variety of minor keywords to provide maximum coverage of potential results – for example “a,” “the,” “of,” “in,” “be,” and “to.” We downloaded only videos that were available under CC BY and CC0 licenses and that had a minimum bitrate of 20 Mbps. The average bitrate of the entire collection was 130 Mbps. We converted all videos to a YUV 4:2:0 chroma subsampling. Our choice employed space-time-complexity clustering to obtain a representative complexity distribution. For spatial complexity, we calculated the average size of x264-encoded I-frames normalized to the uncompressed frame size. For temporal complexity, we calculated the average P-frame size divided by the average I-frame size. We divided the whole collection into 36 clusters using the K-means algorithm and, for each cluster, randomly selected up to 10 candidate videos close to the cluster center. From each cluster’s candidates we manually chose one video, attempting to include different genres in the final dataset (sports, gaming, nature, interviews, UGC, etc.). The result was 36 FullHD videos for further compression.
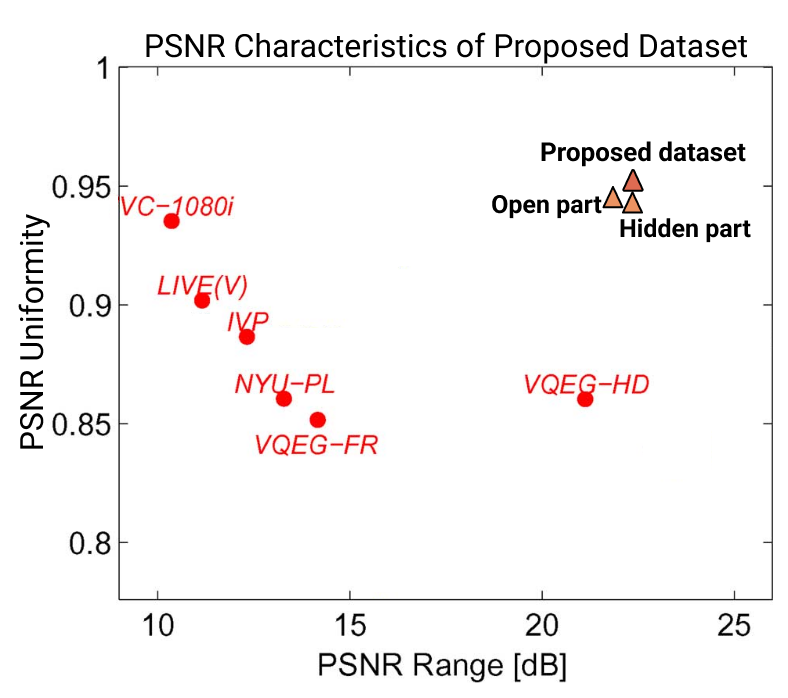
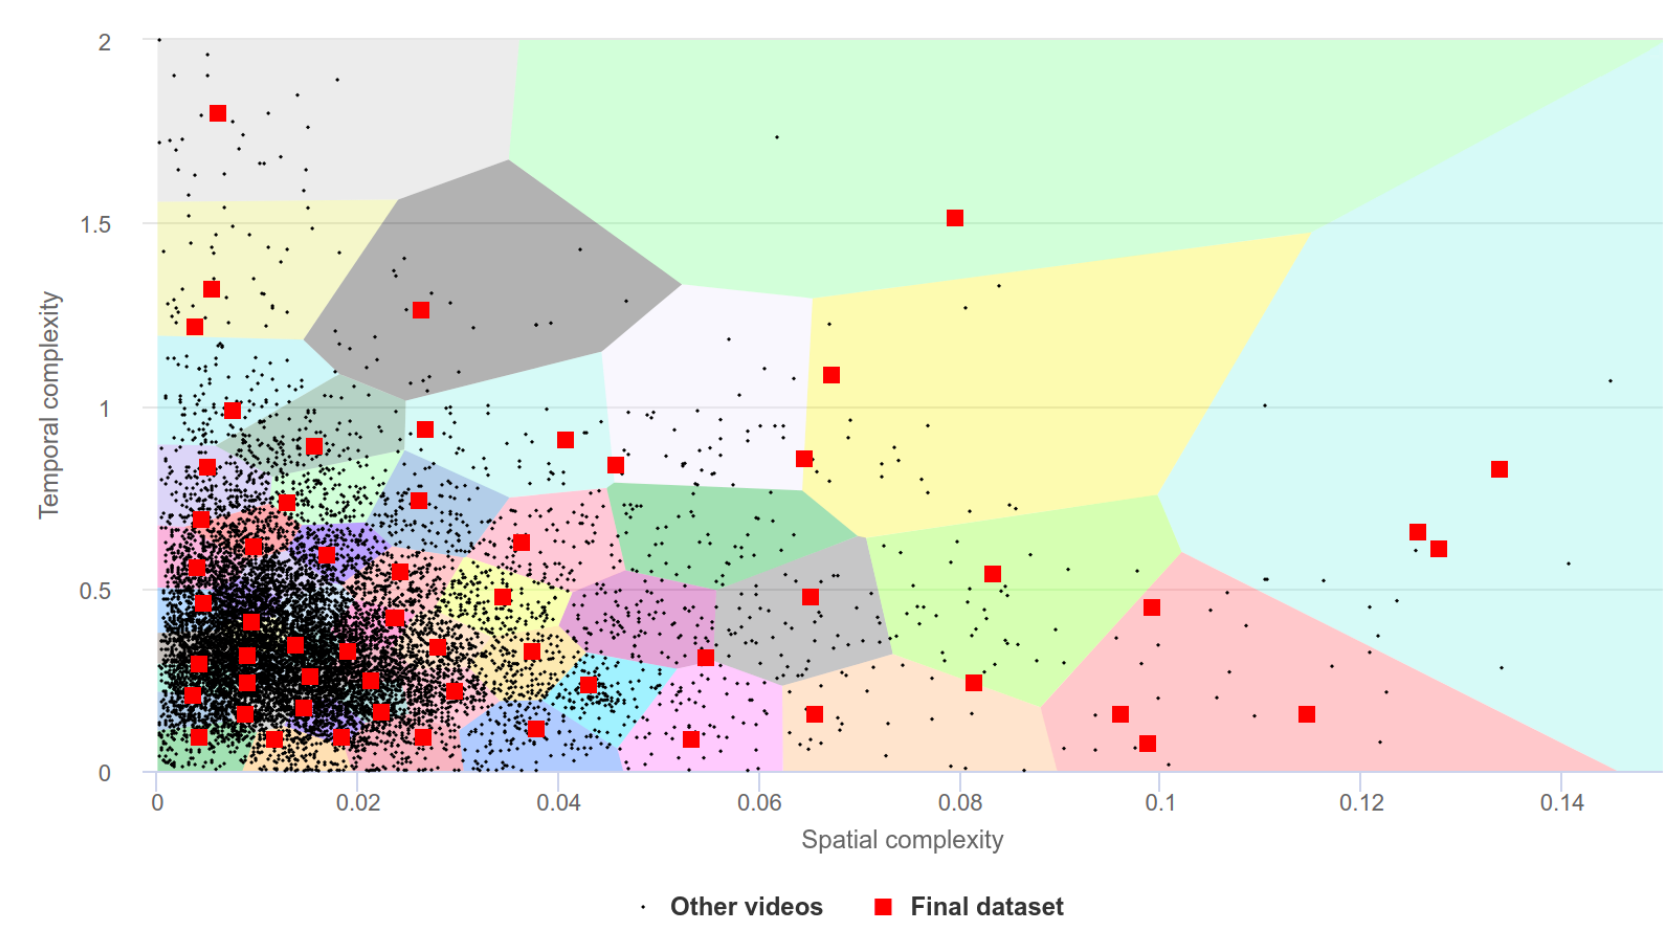
PSNR Range/Uniformity comparison (left); SI/TI characteristics and clusters during dataset creation (right)
For the MSU Video Quality Metrics Benchmark we obtained numerous coding artifacts by compressing videos through 60 several encoders (or 83 ecoders including different presets) of more than 5 compression standards (H.264/AVC, H.265/HEVC, H.266/VVC, AV1, VP9). To increase the diversity of coding artifacts, we also used two different presets for many encoders: one that provides a 30 FPS encoding speed and the other that provides a 1 FPS speed and higher quality. Not all videos underwent compression using all encoders. We compressed each video at three target bitrates — 1,000 kbps, 2,000 kbps, and 4,000 kbps — using a VBR mode (for encoders that support it) or with corresponding QP/CRF values that produce these bitrates. We avoided higher target bitrates because visible compression artifacts become almost unnoticeable, hindering subjective comparisons. The figure below shows the distribution of video bitrates for our dataset. The distribution differs from the target encoding rates because we used the VBR encoding mode, but it complies with the typical recommendations.
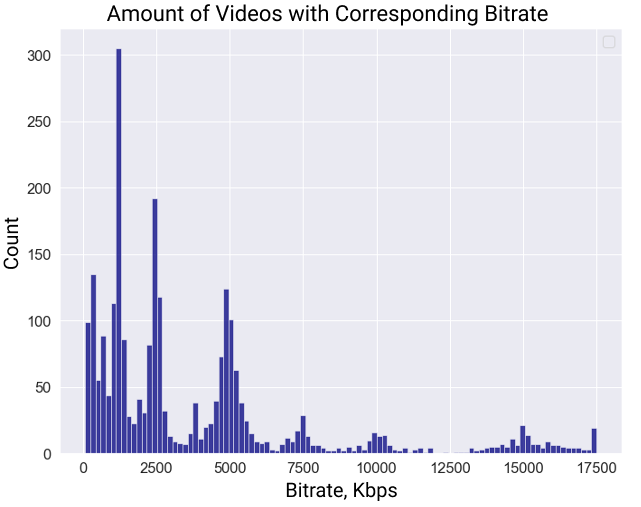
Bitrate distribution of distorted videos
The MSU Video Quality Metrics Benchmark dataset falls into two parts: open (CVQAD) and hidden (60% of the entire dataset). As noted above, we employ hidden part only for testing through our benchmark to prevent learning-based methods from training on the entire dataset, thereby avoiding overfitting and incorrect results. To divide our dataset, we split the codec list in two; the encoded videos each reside in the part corresponding to their respective codec. We also performed x265-lossless encoding of all compressed streams to simplify further evaluations and avoid issues with nonstandard decoders. We also compared the statistics of PSNR uniformity and range for our dataset using the approach in [1].
Subjective-Score Collection
We collected subjective scores for our video dataset through the Subjectify.us crowdsourcing platform. Subjectify.us is a service for pairwise comparisons; it employs a Bradley-Terry model to transform the results of pairwise voting into a score for each video. A more detailed description of the method is at www.subjectify.us. Because the number of pairwise comparisons grows exponentially with the number of source videos, we divided the dataset into 36 subsets by source videos and encoding presets and performed five comparisons. Each subset contained a group of source videos and their compressed versions. Every comparison produced and evaluated all possible pairs of compressed videos for one source video. Thus, only videos from the same source (and encoding preset) were in each pair. The comparison set also included source videos. Participants viewed videos from each pair sequentially in full-screen mode. They were asked to choose the video with the best visual quality or indicate that the two are of the same quality. They also had an option to replay the videos. Each participant had to compare a total of 12 pairs, two of which had an obviously higher-quality option and served as verification questions. All responses from those who failed to correctly answer the verification questions were discarded. To increase the relevance of the results, we solicited at least 10 responses for each pair.
In total, for the MSU Video Quality Metrics Benchmark dataset we collected 766,362 valid answers from nearly 11,000 individuals. After applying the Bradley-Terry model to a table of pairwise ranks, we received subjective scores that are consistent within each group of videos compressed from one reference video.
Crowd-sourced subjective
quality evaluation platform
- Conduct comparison of video codecs and/or encoding parameters
What is it?
Subjectify.us is a web platform for conducting fast crowd-sourced subjective comparisons.
The service is designed for the comparison of images, video, and sound processing methods.
Main features
- Pairwise comparison
- Detailed report
- Providing all of the raw data
- Filtering out answers from cheating respondents
Subjectify.us
Citation
|
@inproceedings{
NEURIPS2022_59ac9f01,
author = {Antsiferova, Anastasia and Lavrushkin, Sergey and Smirnov, Maksim and Gushchin, Aleksandr and Vatolin, Dmitriy and Kulikov, Dmitriy},
booktitle = {Advances in Neural Information Processing Systems},
editor = {S. Koyejo and S. Mohamed and A. Agarwal and D. Belgrave and K. Cho and A. Oh},
pages = {13814--13825},
publisher = {Curran Associates, Inc.},
title = {Video compression dataset and benchmark of learning-based video-quality metrics},
url = {https://proceedings.neurips.cc/paper_files/paper/2022/file/59ac9f01ea2f701310f3d42037546e4a-Paper-Datasets_and_Benchmarks.pdf},
volume = {35},
year = {2022}
}
|
Reference
- Stefan Winkler. Analysis of public image and video databases for quality assessment. IEEE Journal of Selected Topics in Signal Processing, 6(6):616–625, 2012. 5
-
MSU Benchmark Collection
- Super-Resolution Quality Metrics Benchmark
- Video Colorization Benchmark
- Video Saliency Prediction Benchmark
- LEHA-CVQAD Video Quality Metrics Benchmark
- Learning-Based Image Compression Benchmark
- Super-Resolution for Video Compression Benchmark
- Defenses for Image Quality Metrics Benchmark
- Deinterlacer Benchmark
- Metrics Robustness Benchmark
- Video Upscalers Benchmark
- Video Deblurring Benchmark
- Video Frame Interpolation Benchmark
- HDR Video Reconstruction Benchmark
- No-Reference Video Quality Metrics Benchmark
- Full-Reference Video Quality Metrics Benchmark
- Video Alignment and Retrieval Benchmark
- Mobile Video Codecs Benchmark
- Video Super-Resolution Benchmark
- Shot Boundary Detection Benchmark
- The VideoMatting Project
- Video Completion
- Codecs Comparisons & Optimization
- VQMT
- MSU Datasets Collection
- Metrics Research
- Video Quality Measurement Tool 3D
- Video Filters
- Other Projects