First Annual MSU MPEG-4 AVC/H.264 Video Codec Comparison
For professional users and codec authors
Return to first H.264/AVC comparison home page!
Part 3. Additional testing
Average brightness shift diagrams
These diagrams show average shift of brightness produced by the codecs. Coordinates of the basic points represent average brightness values for the whole sequence and the number of measurement (bit rate). So each branch contains ten points that correspond to different bit rates.
Bankomatdi sequence

Picture 36. Y-difference. Sequence bankomatdi
Conclusions:
- All the H.264 codecs raise average brightness in the sequence. The more is the bit rate the more brightness changes.
- Fraunhofer codec raises brightness stronger than the other codecs.
Battle sequence

Picture 37. Y-difference. Sequence battle
Conclusions:
- All the H.264 codecs raise average brightness in the sequence. The more is the bit rate the more brightness changes.
- Videosoft codec raises brightness stronger than the other codecs.
Bbc3di sequence

Picture 38. Y-difference. Sequence bbc3di
Conclusions:
- All the H.264 codecs raise average brightness in the sequence on the average and high bit rates. The more is the bit rate the more brightness changes.
- Change of brightness on the low bit rates is small.
Foreman sequence

Picture 39. Y-difference. Sequence foreman
Conclusions:
- All the H.264 codecs except Fraunhofer strongly raise average brightness in the sequence. The more is the bit rate the more brightness changes.
Susidi sequence

Picture 40. Y-difference. Sequence susidi
Conclusions:
- All the H.264 codecs strongly raise average brightness in the sequence. This change is approximately constant for all the bit rates.
Bit rate handling diagrams
These diagrams show how codecs handle different bit rates. Every branch consists of ten points that correspond to different bit rates. Value “1” means that the codec keeps the specified bit rate; value more than “1” means that the codec actually compresses with the higher bit rate than was specified.
Bankomatdi sequence

Picture 41. Bit rate handling. Sequence bankomatdi
Conclusions:
- Videosoft codec slightly increases specified low bit rates.
- DivX codec increases specified low bit rates.
Battle sequence

Picture 42. Bit rate handling. Sequence battle
Conclusions:
- Videosoft codec slightly increases specified low bit rates.
- DivX and MainConcept codecs strongly increase specified low bit rates.
Bbc3di sequence

Picture 43. Bit rate handling. Sequence bbc3di
Conclusions:
- All the H.264 codecs slightly increase specified low bit rates.
- DivX codec strongly increases specified low bit rates.
Foreman sequence

Picture 44. Bit rate handling. Sequence foreman
Conclusions:
- MainConcept significantly decreases specified bit rates.
- DivX increases specified bit rates.
Susidi sequence

Picture 45. Bit rate handling. Sequence susidi
Conclusions:
- DivX increases specified low bit rates.
Per frame sequences comparison
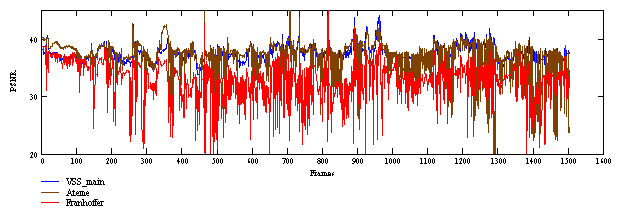
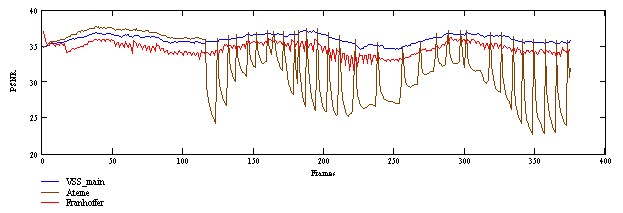
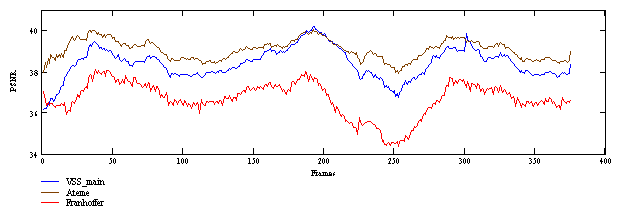
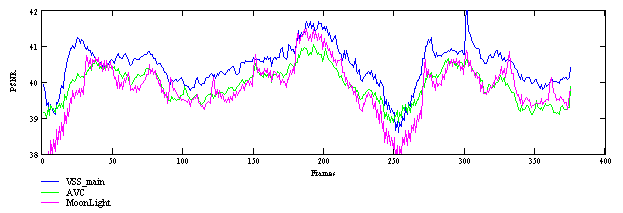
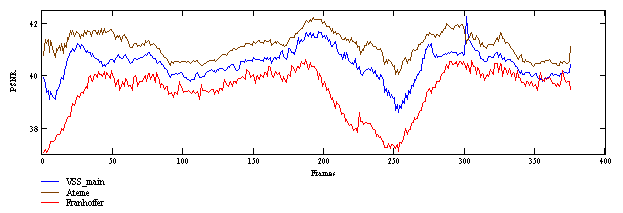
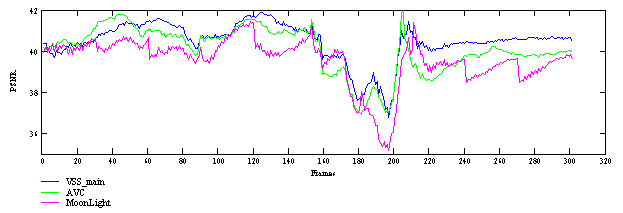
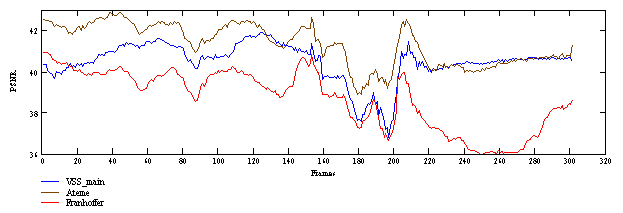
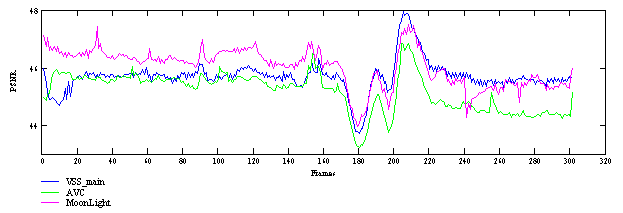
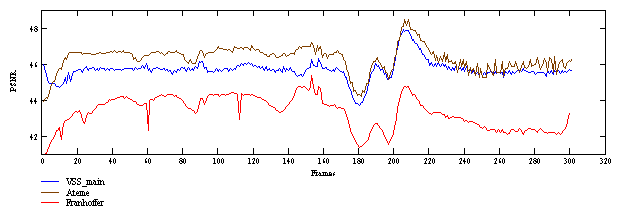
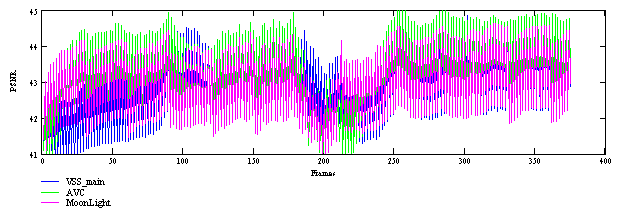
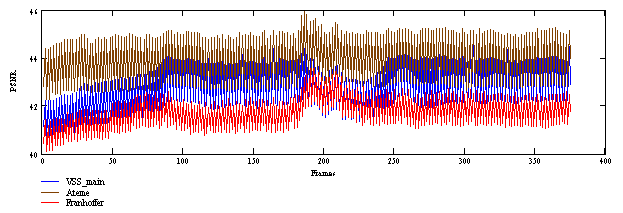
These diagrams show how compression quality changes from frame to frame. X-axis coordinate represents the number of the frame and Y-axis coordinate represents PSNR-value for this frame. Significant constant difference on the susidi diagram is caused by the noise suppression in every second frame (B-frames options in MPEG-2 coder).
Bankomatdi sequence
Bit rate = 100 Kb/sec


Bit rate = 700 Kb/sec


Bit rate = 2340 Kb/sec


Battle sequence
Bit rate = 100 Kb/sec

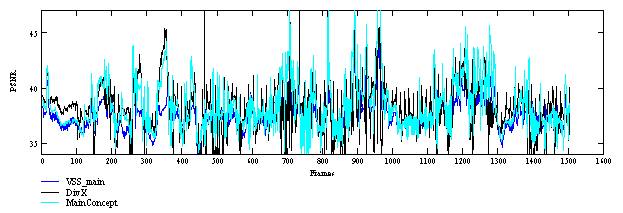
Bit rate = 700 Kb/sec
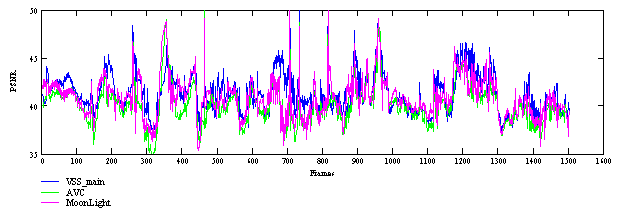
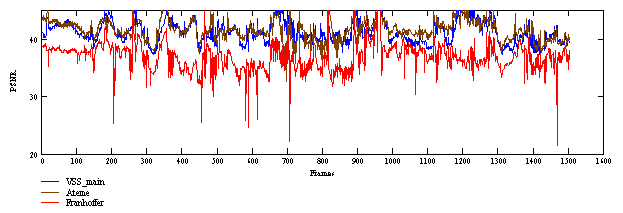
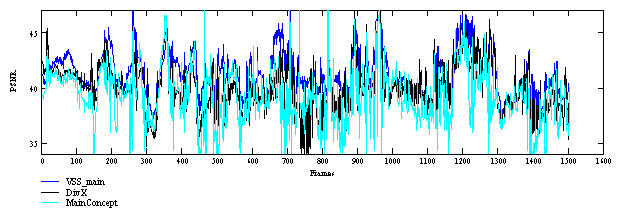
Bit rate = 2340 Kb/sec
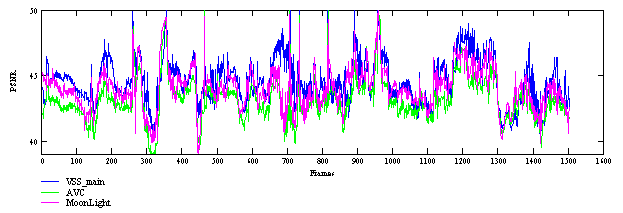
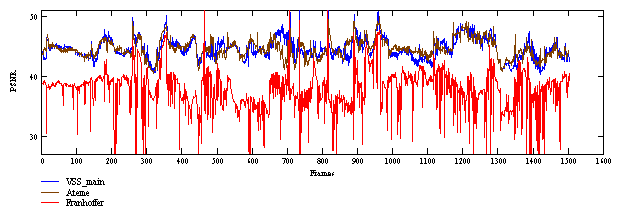
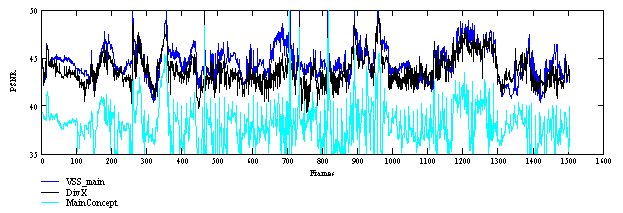
Bbc3di sequence
Bit rate = 100 Kb/sec


Bit rate = 700 Kb/sec


Bit rate = 2340 Kb/sec

Foreman sequence
Bit rate = 100 Kb/sec
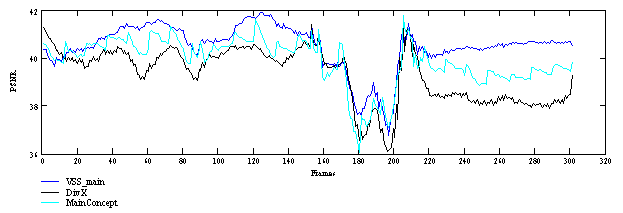
Bit rate = 700 Kb/sec
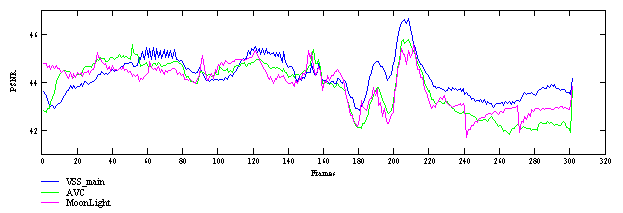
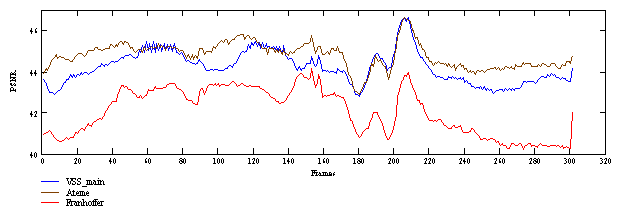
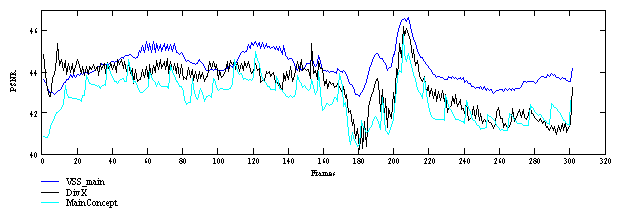
Bit rate = 2340 Kb/sec
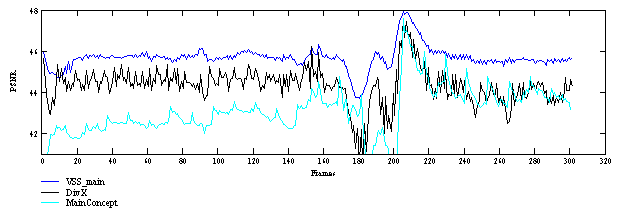
Susidi sequence
Bit rate = 100 Kb/sec
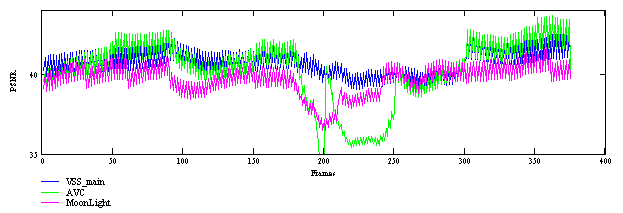
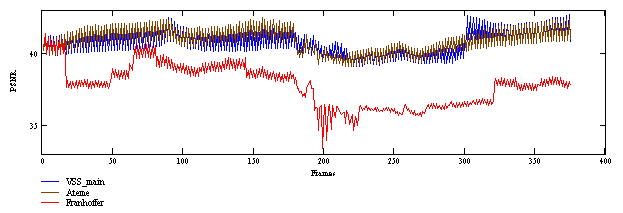

Bit rate = 700 Kb/sec
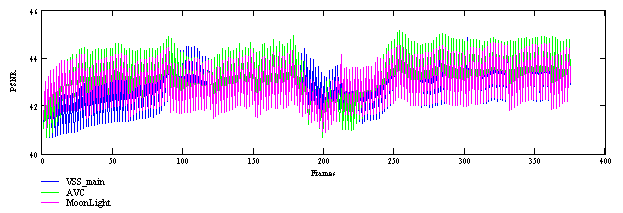
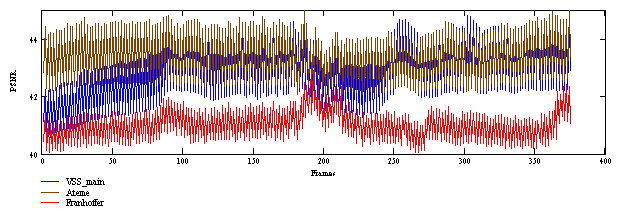

Bit rate = 2340 Kb/sec

Visual comparison of H.264 and DivX codecs
- Comparison was performed between the Ateme and DivX codecs.
- Bit rate was set to 700 Kb/sec.
- Bbc2di and foreman video sequences were used.
Bbc3di sequence, frame 280
The following examples demonstrate better image quality after compression with the H.264 codec in comparison with DivX.
 |
 |
| Picture 46. Bbc3di frame 280. Ateme | Picture 47. Bbc3di frame 280. DivX |
 |
 |
| Picture 48. Bbc3di frame 280. Ateme | Picture 49. Bbc3di frame 280. DivX |
 |
 |
| Picture 50. Bbc3di frame 280. Ateme | Picture 51. Bbc3di frame 280. DivX |
Foreman sequence, frames 282 and 9
The following examples demonstrate better image quality after compression with the H.264 codec in comparison with DivX.
 |
 |
| Picture 52. Foreman frame 282. Ateme | Picture 53. Foreman frame 282. DivX |
 |
 |
| Picture 54. Foreman frame 282. Ateme | Picture 55. Foreman frame 282. DivX |
 |
 |
| Picture 56. Foreman frame 282. Ateme | Picture 57. Foreman frame 282. DivX |
Conclusion:
- On similar PSNR values H.264 standard codecs show significantly better visual quality than previous standard codecs.
- Most of tested codecs are optimized for maximum speed on current day computers and do not implement all possibilities of H.264 format
The following examples demonstrate close results from the image quality point of view for DivX and H.264.
 |
 |
| Picture 58. Foreman frame 9. Ateme | Picture 59. Foreman frame 9. DivX |
 |
 |
| Picture 60. Foreman frame 9. Ateme | Picture 61. Foreman frame 9. DivX |
 |
 |
| Picture 62. Foreman frame 9. Ateme | Picture 63. Foreman frame 9. DivX |
-
MSU Benchmark Collection
- Super-Resolution Quality Metrics Benchmark
- Super-Resolution Quality Metrics Benchmark
- Video Colorization Benchmark
- Video Saliency Prediction Benchmark
- LEHA-CVQAD Video Quality Metrics Benchmark
- Learning-Based Image Compression Benchmark
- Super-Resolution for Video Compression Benchmark
- Defenses for Image Quality Metrics Benchmark
- Deinterlacer Benchmark
- Metrics Robustness Benchmark
- Video Upscalers Benchmark
- Video Deblurring Benchmark
- Video Frame Interpolation Benchmark
- HDR Video Reconstruction Benchmark
- No-Reference Video Quality Metrics Benchmark
- Full-Reference Video Quality Metrics Benchmark
- Video Alignment and Retrieval Benchmark
- Mobile Video Codecs Benchmark
- Video Super-Resolution Benchmark
- Shot Boundary Detection Benchmark
- The VideoMatting Project
- Video Completion
- Codecs Comparisons & Optimization
- VQMT
- MSU Datasets Collection
- Metrics Research
- Video Quality Measurement Tool 3D
- Video Filters
- Other Projects
