Detection of stereo window violation
- Author: Alexander Bokov
- Supervisor: dr. Dmitriy Vatolin
Introduction
In stereoscopic videos, when an object has negative parallax (appears to be close to the spectator) and moves in or out of the frame, some portions of the object are present in only one view. This edge violation causes discomfort and cumulative peripheral eyestrain for the viewers.

Window violation: a part of the house is visible in the left view, but is not represented in the right view
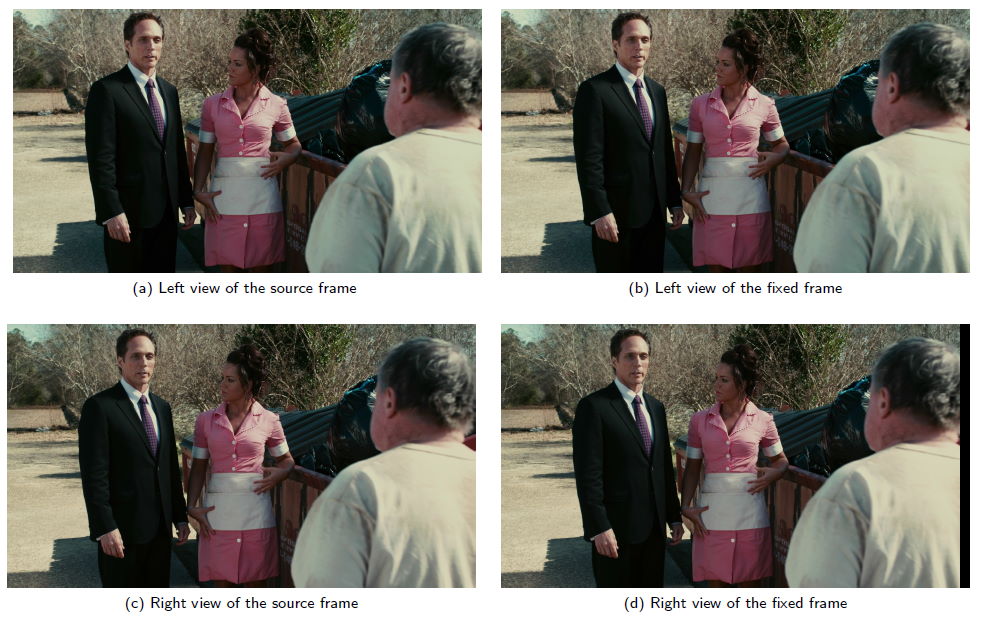
To fix the stereo window violation, stereographers use the floating window technique, which removes the portions of the object which do not have correspondences in the other view. The resulting cropped stereopair provides a more immersive experience and removes confusing peripheral signals to the viewer’s brain.

Left column – original stereopair, right column – stereopair with floating window applied
We provide two different metrics for stereo window violation analysis: stereo window placement comfort measured in MSU-StereoWindowComfort-2014 and quality of stereo window violations handling measured in MSU-StereoViolationHandling-2014.
The MSU-StereoWindowComfort-2014 metric aims to assess viewing comfort. It takes into account both average stereo window violation noticeability (which depends on the size and sharpness of edge-violating object) and average depth distribution across the movie (we consider an imbalanced parallax range shifted towards positive values to be less comfortable). Thus, the metric penalizes movies that achieved low stereo window violation noticeability by means of placing nearly all the content behind the screen.
The MSU-StereoViolationHandling-2014 metric is more technical. It is designed to measure how well potentially problematic negative parallax content is handled across the given movie. Proper use of floating windows and placing all negative parallax content far from screen edges are both considered to be acceptable techniques.
Experiments

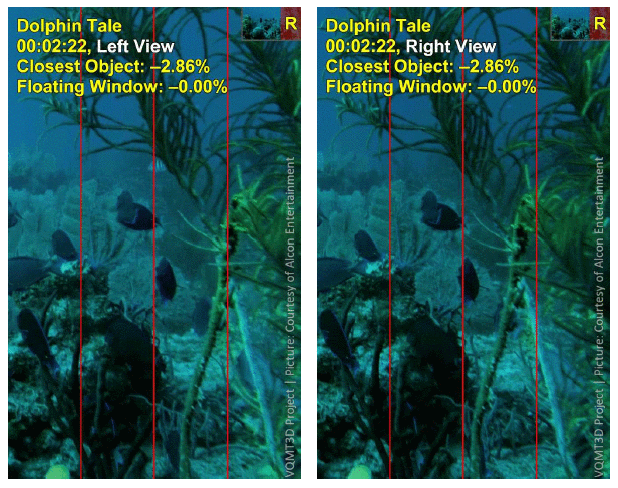
A severe window violation example in “Dolphin Tale” movie
Much more real-life examples can be found in our report 6 and report 7. Overall comparisons will soon be available in report 10 under all reports.
We computed the proposed metrics for 105 movies. The following diagrams depict the metric value for each movie relative to its release date:


A magnified portion of the diagram


A magnified portion of the diagram
-
MSU Benchmark Collection
- Super-Resolution Quality Metrics Benchmark
- Super-Resolution Quality Metrics Benchmark
- Video Colorization Benchmark
- Video Saliency Prediction Benchmark
- LEHA-CVQAD Video Quality Metrics Benchmark
- Learning-Based Image Compression Benchmark
- Super-Resolution for Video Compression Benchmark
- Defenses for Image Quality Metrics Benchmark
- Deinterlacer Benchmark
- Metrics Robustness Benchmark
- Video Upscalers Benchmark
- Video Deblurring Benchmark
- Video Frame Interpolation Benchmark
- HDR Video Reconstruction Benchmark
- No-Reference Video Quality Metrics Benchmark
- Full-Reference Video Quality Metrics Benchmark
- Video Alignment and Retrieval Benchmark
- Mobile Video Codecs Benchmark
- Video Super-Resolution Benchmark
- Shot Boundary Detection Benchmark
- The VideoMatting Project
- Video Completion
- Codecs Comparisons & Optimization
- VQMT
- MSU Datasets Collection
- Metrics Research
- Video Quality Measurement Tool 3D
- Video Filters
- Other Projects
